Code Instrumentation Practices to Improve Debugging Productivity
Code instrumentation is closely tied to debugging. Ask one of the experienced developers and they will swear by it for their day-to-day debugging needs. With modest beginnings in the form of print statements that label program execution checkpoints, present-day developers employ a host of advanced techniques for code instrumentation. When carried out in the right way, it improves developer productivity and also reduces the number of intermediate build/deployment cycles for every bug fix. However, with the advent of modern software architecture, it assumes more importance since architectures have become more complex for developers.
At Lightrun, our vision is to empower developers to debug live applications, on-demand, in real-time, and sans any disruption. Therefore, we have built our platform with a focus on adopting newer code instrumentation techniques that enhance the developer experience to a new level.
In this blog post, we will peer into the fundamental practices of code instrumentation as they have been traditionally employed, and examine the challenges and opportunities for enhancing developer experience.
Five Common Practices in Code Instrumentation
Code instrumentation is the process of adding code that captures the runtime behavior of an application. This code does not contribute to the business logic, nor does it have any bearing on runtime performance. It is purely used as a means of telemetry to capture data based on the internal context of the application.
Since every software is unique, there is no way to uniformly define the telemetry data generated through code instrumentation. Nevertheless, standard practices around code instrumentation have evolved to help developers during their debugging sessions.
Let’s examine these practices, their shortcomings, and the Lightrun way to achieve superior debugging productivity.
Practice 1: Recording Runtime Behavior Through Log Statements
A log is a single record of telemetry data. It can either be a simple display message, or it captures the internal state of a variable. A log record always contains a timestamp and additional information to point to the codebase from where the record is emitted.
In a typical software development workflow, log statements are added to the codebase at prominent places. For example, at the time of initialization, business logic execution, and error handling blocks. Traditionally, these log statements were added during the development phase. Therefore they are part of the source code.
During runtime, the software application generates a time-sequenced stream of log records, as per the execution sequence of the log statement within the source code. Afterward, developers backtrack the sequence of log records to identify the root cause of a bug.
The Lightrun Way: Dynamic Logging Without Impacting the Source Code
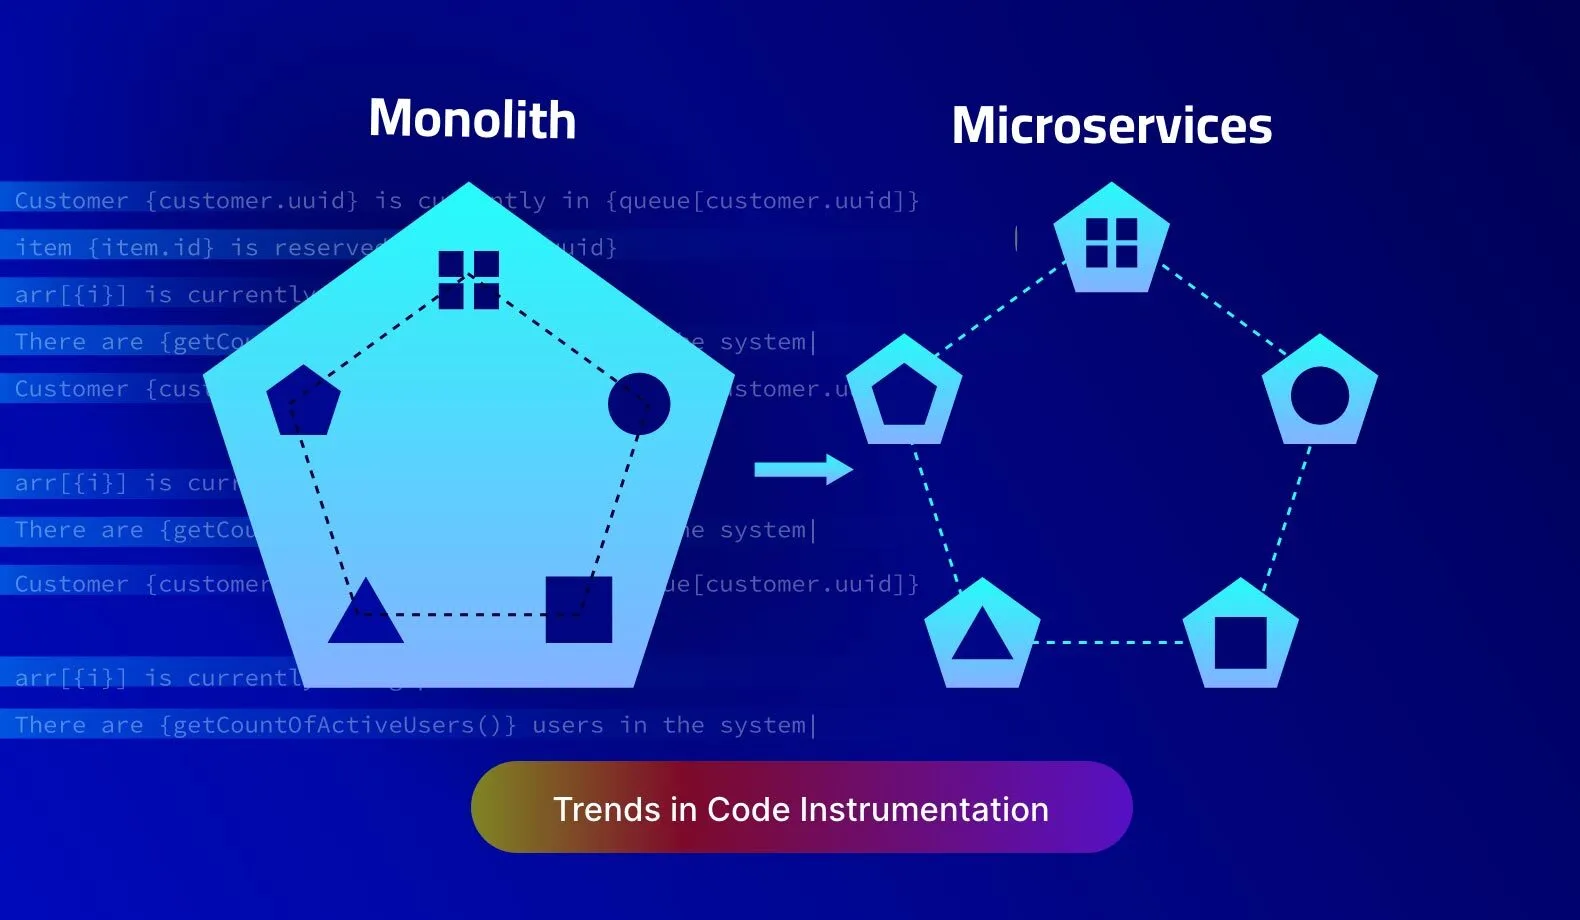
The traditional approach of adding log statements directly in the source code is called static instrumentation. While it is still effective for monolithic software architectures, it does not align well with the developer workflows in a microservices debugging environment where multiple log streams are generated from multiple services.
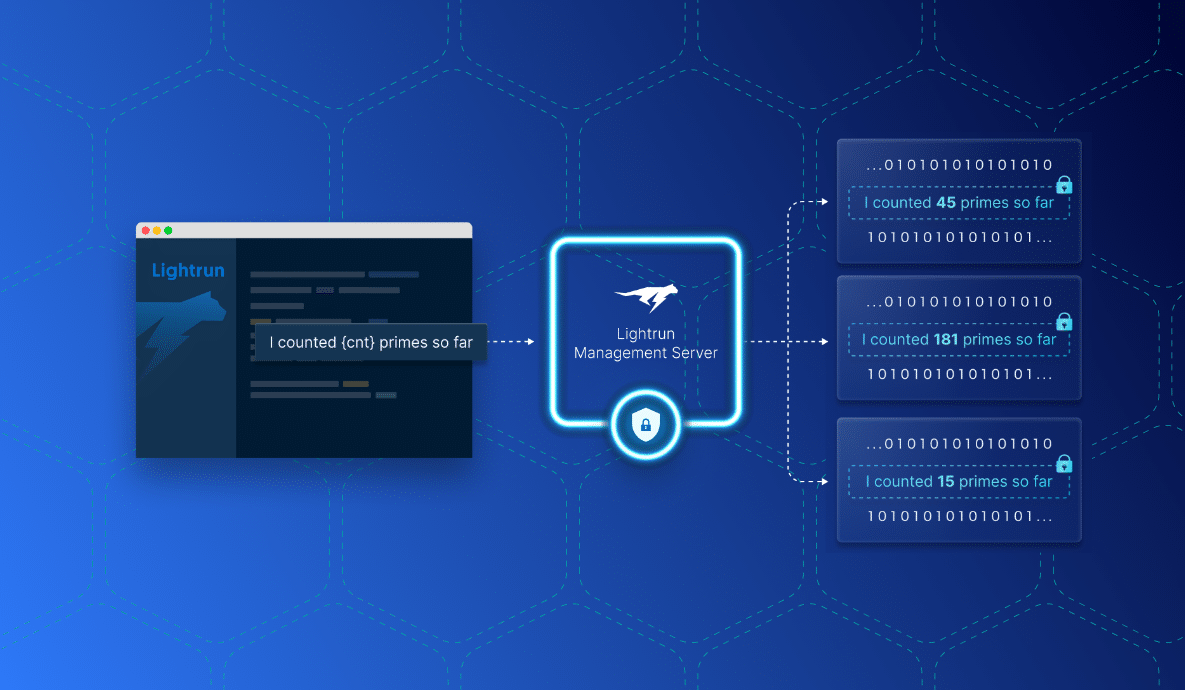
With dynamic code instrumentation powered by Lightrun, developers have the ability to add logs at runtime without modifying the source code. These logs can be collated into a single stream for analysis. They can be enabled or disabled in runtime, without needing additional build or deployment cycles.
Practice 2: Analyzing Runtime Behavior Through Tracing
Tracing helps unravel the stack of running software during runtime. The stack consists of function call records, each representing the local data of the function, cascading down to the main or entry function that starts the runtime execution.
Conventionally, traces are generated via a debugger tool that injects breakpoints in the source code. Upon hitting the breakpoint, the debugger halts the execution of the runtime and exposes the current stack. The developer can then examine function calls while also keeping an eye on the local state of each function.
The Lightrun Way: Real-Time Snapshots Without Disrupting Production Deployment
Using a debugger for tracing the source code is detrimental to production debugging since it is not possible to halt a live application. In such cases, developers have to recreate the bug in a separate developer environment and redeploy it with the fix.
With Lightrun, developers can generate snapshots of the running application by setting a virtual breakpoint. A virtual breakpoint generates a snapshot of the current stack without halting the execution of the program, and developers can examine the stack of a live application on the go.
Practice 3: Measuring Runtime Performance Through Profiling
Software profiling is a way to measure runtime performance, with respect to time, for a given set of inputs or algorithmic complexity. The measurement may also include some key resources such as memory consumption.
The typical way of profiling is via log statements to measure the time elapsed between two code execution points. For detailed analysis, a profiling framework must be embedded in the runtime. Different programming languages also offer tools to profile code. For example, Node.js ships with a built-in profiler that can be enabled with the ‘–prof’ switch.
The Lightrun Way: Built-In Profiling Metrics Without Leaving the Comfort of IDE
The usual profiling frameworks add a lot of overhead to the application runtime. Therefore, they cannot be used in a production environment. Whereas most performance issues are spotted in production, developers are helpless since they do not know the source of these issues.
By embedding the Lightrun SDK, developers can generate frequently used profiling metrics such as method durations, the execution time of a code block, or the count of code line executions. The SDK is lightweight and performant, thereby avoiding any additional overheads in a production application. These metrics can be enabled in the IDE and the profiling data is instantly accessible on the Lightrun console.
Practice 4: Capturing Key Performance Indicators Through Custom Metrics
There are occasions when the usual profiling information is not sufficient to analyze the runtime performance of a software application. These are highly business logic specific scenarios relevant to mission-critical applications. Such applications must capture custom key performance indicators (KPI) metrics for advanced profiling.
Capturing custom data in such cases requires additional code. One obvious way is to write log statements with computation expressions that calculate and log a KPI.
The Lightrun Way: Custom Metrics Without Writing Additional Code
Adding additional code for calculating a custom metric has the same pitfalls as static code instrumentation. Moreover, it also has a potential runtime performance impact if the developer does not take steps to make this code efficient.
Using the Lightrun CLI, developers can add custom metrics, using conditional expressions that evaluate to an integer result. This does not impact the source code as these metrics are generated through runtime code manipulation in a secure and performant way.
Practice 5: Injecting Temporary Code for Brute-force Analysis
There are occasions when merely analyzing the telemetry data from code instrumentation isn’t enough to debug a problem. Most of these problems manifest in the form of data races, or deadlocks among multiple runtime components.
Under such circumstances, the usual code instrumentation practices become futile. For example, if there is a deadlock due to a mutual dependency between two services, then the execution of both will halt, and no telemetry data is generated for the developer to analyze further. These situations call for developers’ ingenuity to add temporary code to unblock the deadlock.
This practice cannot be considered part of code instrumentation, since it is more like a debugging tactic to brute-force a behavior. However, in most cases, it is clubbed with one of the above four practices to help developers quickly generate some telemetry output to find the root cause of hard-to-find bugs.
The Lightrun Way: Stay Connected To Live Applications Without Debugging Hacks
The brute-force mechanism is only applicable if the developer is working on a non-production application. Moreover, it does not yield a standard code instrumentation output that can act as supporting evidence for the root cause analysis of a bug.
With Lightrun, adding dynamic logs, real-time snapshots, or metrics is very easy as it can be done within the IDE. It works well with the developer workflow and avoids the overheads of replicating the production environment in a separate debugging environment. Thereby, Lightrun offers developers all the flexibility to debug any issue right at the spot where it happens, without the need to employ any brute-force tactics.
Lightrun currently supports Java, Kotlin, Node.js, Python, and .NET/C#. IDE plugins are available for IntelliJ IDEA, VS Code, PyCharm, and WebStorm. To take the Lightrun platform for a spin, sign up for a free trial!
It’s Really not that Complicated.
You can actually understand what’s going on inside your live applications.