How to Optimize the DevOps Pipeline Through Developer Workflows
Dec 06, 2022

The DevOps pipeline is a crucial part of software development, but it can often get mired in bottlenecks. Most problems are caused by the development and operations teams having different responsibilities are due to inefficiencies in the pipeline design. However, thanks to continuous observability, DevOps now gets a new lease of life since it is possible to tweak the pipeline to suit the developer’s workflow. In this blog post, we’ll explore how to optimize DevOps for developers to debug production issues.
The Traditional DevOps Process
Here is a typical DevOps process:
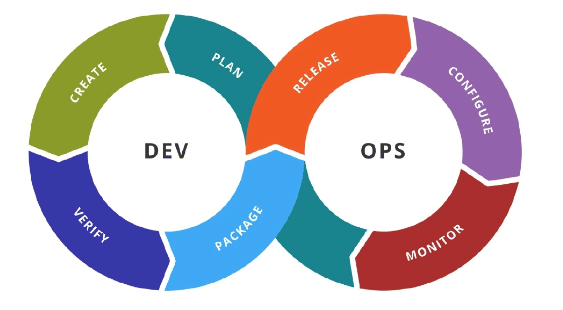
This process flow needs no explanation. A DevOps team spins off this process into multiple pipelines, spanning different environments based on their DevOps strategy. A close look at this process flow makes it evident that it is designed to operate on a cyclical pattern, where the development side feeds the operations and back.
The DevOps Feedback Loop
The traditional DevOps process follows a linear flow suited for greenfield deployments when the software has less complexity. However, as complexity grows, there is a need to introduce feedback loops. In a DevOps process, there are two main types of feedback: feedback from developers to operations and from operations to developers.
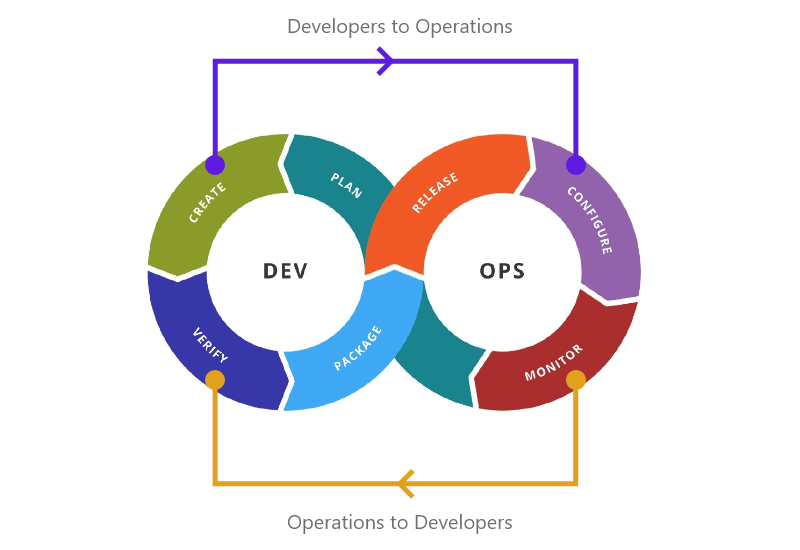
Feedback from developers to operations informs the operations team about the state of the code and how it is progressing. This input helps operations plan for configuration changes in the upcoming release. On the other hand, feedback from operations to developers is used to provide information about the system’s performance. This information helps developers understand the runtime behavior of the system.
But what if the system performance deteriorates significantly, or even worse, it breaks down completely? That’s where the linear progression of the DevOps process becomes inefficient.
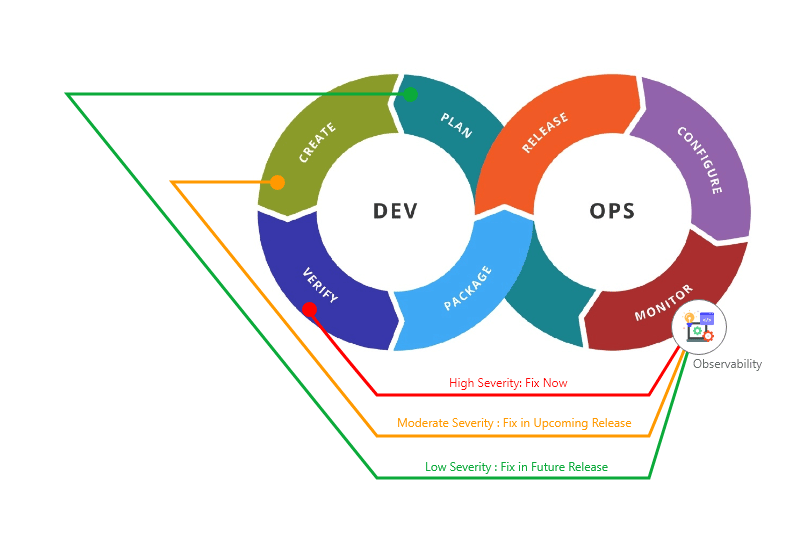
Triaging DevOps Pipeline with Observability
Observability enables a software system’s internal functioning to be analyzed without introducing code changes. Furthermore, by embedding observability into the software’s DevOps pipeline, it is possible to triage the pipeline as per the severity of the system performance.
The Development vs. Operations Dilemma
The ability to triage a system performance issue brings a lot of clarity about the course of action. But executing those actions through the DevOps process has a few challenges.
Operations Dilemma: Tweak the DevOps Pipeline for Release or Defects
As we know, any DevOps practice has two fundamental principles, continuity and automation. Therefore, all DevOps processes are designed as continuous pipeline phases, which are automated based on developer actions or the result of previous pipeline steps.
This arrangement is ideal for executing new release cycles. However, addressing critical defects in production requires a quick turnaround, and the continuous pipeline progression poses a barrier. Also, the DevOps process cannot be automated to triage the pipeline based on the severity of production defects.
Developers Dilemma: Test in Production or Redeploy
Overcoming operational inefficiencies requires manual intervention based on close coordination between development and operations teams to test the defects in the production environment.
Often, this coordination can be inefficient if, for example, developers need more information and seek to deploy the software in a different environment with repeated builds to analyze the issues.
Enter Continuous Observability: Developers Playground in Operations Arena
Continuous observability is a streamlined process that lets developers have complete visibility into the system’s internal state and identify issues as they happen. It augments the DevOps pipeline to provide runtime data captured across all phases of a pipeline without redeploying it.
The result: better visibility on system performance and shorter turnaround times in identifying defects.
Continuous observability harmonizes the development and operations teams such that they collaborate more effectively. But, more importantly, it makes developers feel more at home by easing their workflow in a few ways.
Short-circuiting DevOps Processes for Production Debugging
Short-circuiting the DevOps cycle means that when a bug is found in production, the first step is to find the root cause directly in the production code. This approach eliminates the DevOps overheads of recreating the bug in non-production environments.
Continuous observability allows the developers to explore the production software in runtime, thereby saving a lot of time and effort by bypassing the linear flow of DevOps processes for every fix.
DID YOU KNOW
Lightrun Platform supports plugins for popular IDEs such as Visual Studio Code,
IntelliJ, and PyCharm to let developers access the production code right from the
comfort of their favorite IDE without requesting DevOps to spin
off a separate environment.
Probing the Production Code for Live Debugging
Live debugging allows developers to see what is happening in the system in real-time and identify issues as they occur. This is achieved using dynamic logs.
Continuous observability allows developers to troubleshoot live applications by dynamically adding logs anywhere in the application code. This way, they can probe all aspects of the code, such as internal states, variables, function parameters, and calls, to ask questions and get immediate answers through logs. Overall, this practice stands to have a positive impact on the Mean Time to Resolution (MTTR) for every bugfix.
DID YOU KNOW
With Lightrun, developers can add dynamic logs without relaunching the application
or releasing separate versions for debugging. Upon executing the code injected
with logs, the log output is immediately available on the IDE
and Lightrun console for further analysis.
Gathering Performance Metrics for Better Quality Assurance
Apart from troubleshooting, live debugging also lets developers capture performance metrics. These metrics are beneficial for profiling the production system on the fly.
With continuous observability, it is possible to build a real-time performance profile of production software by gathering important metrics, such as counts, timings, and other custom measurements, to identify poorly performing parts of the code. This capability can be further leveraged through data-driven insights to bring in predictive performance analysis of code deployment across all phases of the DevOps pipeline.
DID YOU KNOW
Lightrun can capture metrics across the entire breadth of the application code on
the fly to investigate impending performance issues. In addition,
Lightrun supports integrations with many APM platforms to export and chart
performance metrics thereby, helping to ensure quality assurance
of production software.
Take Charge of Your Production Debugging with Lightrun
If you feel your DevOps process is becoming a bottleneck for debugging production issues, then give Lightrun a try. Sign up for a free Lightrun account. You can refer to the Lightrun docs and get started with Java, Python or Node.js applications immediately.