Full-Cycle Observability With Dynatrace and Lightrun
We are excited to announce that Lightrun has partnered with Dynatrace to combine Lightrun’s real-time, IDE-first observability capabilities inside Dynatrace
Getting a good grasp on your application, especially when it is distributed across multiple clouds, kubernetes clusters and serverless functions is not an easy fit.
When trying to keep up with everything that’s going on inside the application, Dynatrace’s software intelligence observability solution is an excellent platform for helping developers and DevOps be alerted to the existence of issues on the infrastructure and application levels. Lightrun, the developer-native observability platform, helps practitioners go beyond the realm of static application telemetry – traditionally added during the application’s development phase – and enables the real-time extraction of line-by-line, debugger-grade information from live environments right inside Dynatrace.
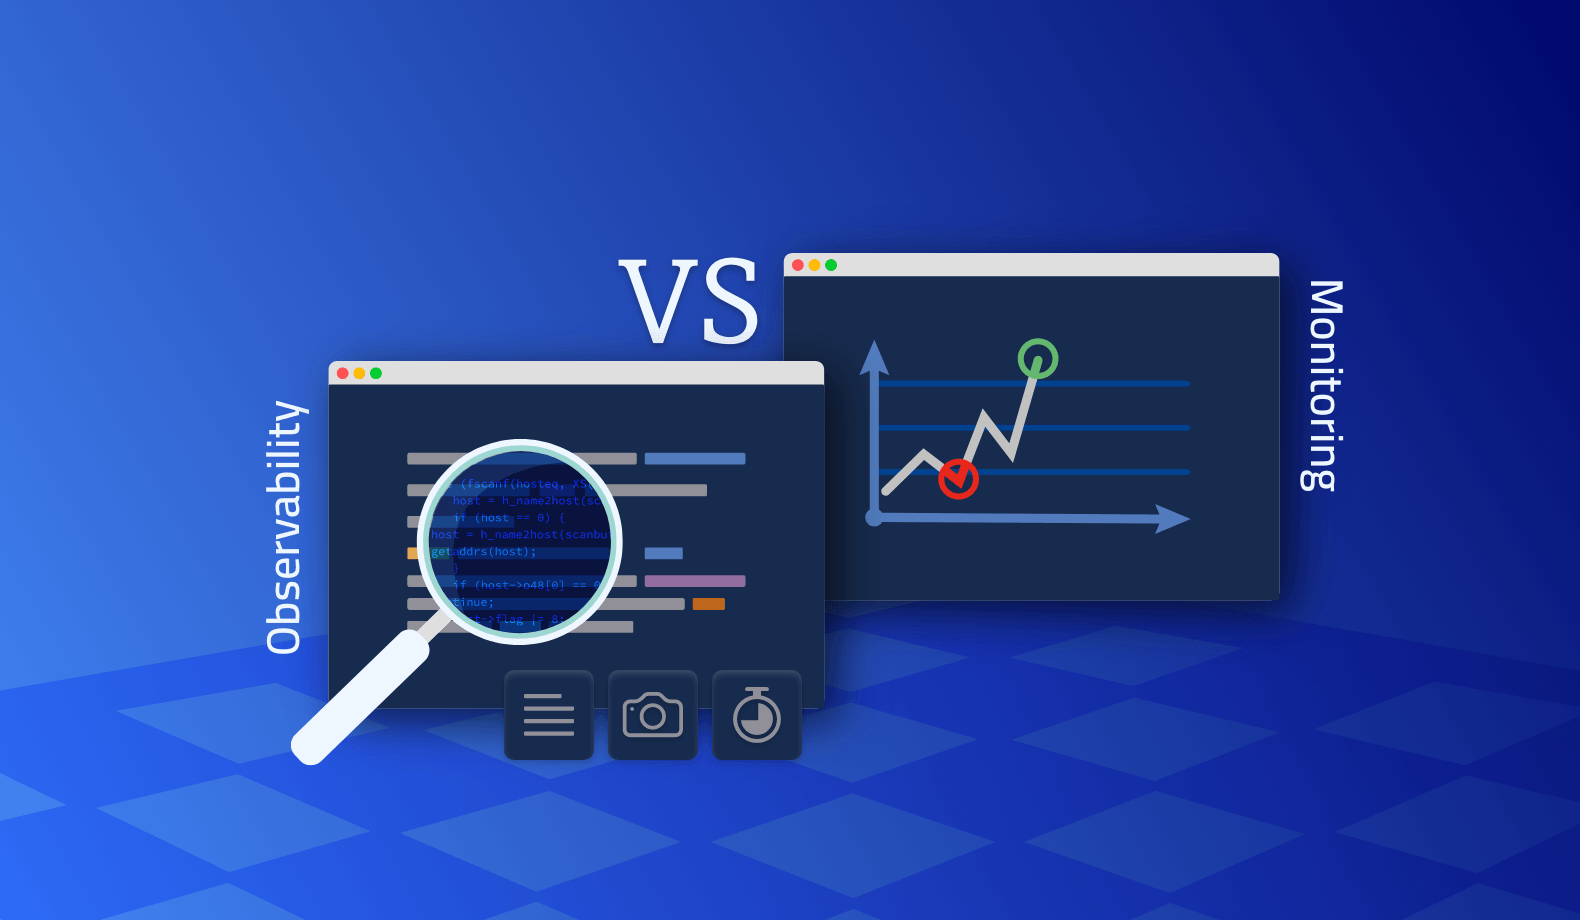
In order to get the “full lay of the land” when things inevitably go wrong, it’s important to be able to access any level of granularity of information from all the relevant components that could have been the root cause of the issue at hand. There’s a term that refers to a system that enables its maintainers to achieve that level of comprehension: Observability.
Observability is best defined as a property of a system – a system that is observable is built in a way that makes it possible to answer any question that might arise about the system without shipping any new code. An observable system is, of course, a great determining factor in whether we can troubleshoot tough bugs quickly and whether our system is considered reliable – faster resolution (usually measured as MTTR – mean time to resolve) is a great indicator for reliability.
When trying to understand what type of information an observable system can produce on its own, it’s best to think about the context where the value of such a system is most apparent – when we’re deep into complex troubleshooting sessions. When tackling tough issues, we often rely on two main types of telemetry data to clarify what is actually happening under the hood: Infrastructure-level information and application-level information.
The integration between Dynatrace and Lightrun allows us to create full-cycle observability – which takes shape in the following form:
- We’ll first use Dynatrace’s analysis and alerting capabilities to become aware of issues, then explore the existing information.This will give us a sense into how the machines running our application or the application itself is behaving, and will surface up various problems (like performance degradations).
- Then, Developers and DevOps can use Lightrun from the IDE to add real-time, on-demand logs, metrics and traces to the running application – without stopping the application or shipping new code.
- The information provided by Lightrun is automatically collected by Dynatrace and can be consumed right next to information provided by Dynatrace itself – closing the aforementioned cycle.
Combining both tools to explore issues from various angles provides a level of visibility into the running application that is enough to solve many critical production issues and understand how the live application is behaving in real-time.
Check out this tutorial on how to use Dynatrace with Lightrun to get started.

It’s Really not that Complicated.
You can actually understand what’s going on inside your live applications.