Observability vs. Monitoring
May 21, 2022 / Updated: Mar 08, 2026

Although all code is bound to have at least some bugs, they are more than just a minor issue. Having bugs in your application can severely impact its efficiency and frustrate users. To ensure that the software is free of bugs and vulnerabilities before applications are released, DevOps need to work collaboratively, and effectively bridge the gap between the operations, development and quality assurance teams.
But there is more to ensuring a bug-free product than a strong team. DevOps need to have the right methods and tools in place to better manage bugs in the system.
Two of the most effective methods are monitoring and observability. Although they may seem like the same process at a glance, they have some apparent differences beneath the surface. In this article, we look at the meaning of monitoring and observability, explore their differences and examine how they complement each other.
What is monitoring in DevOps?
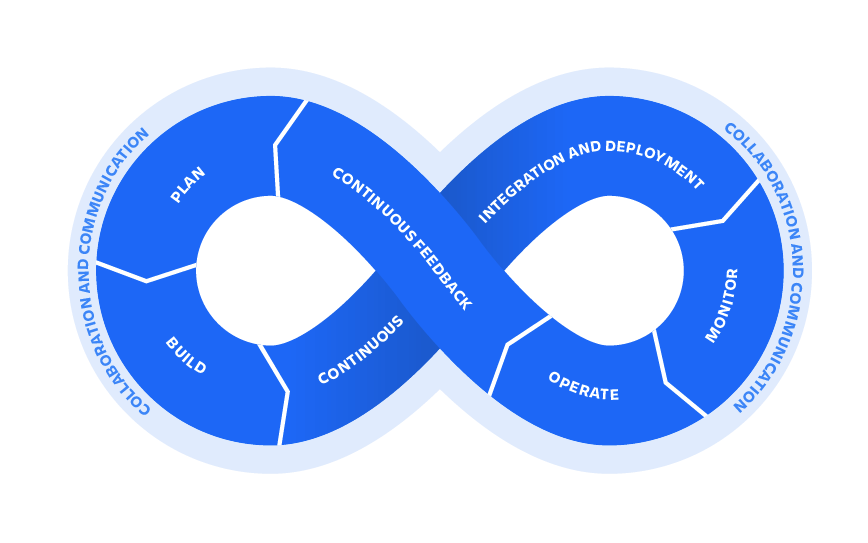
In DevOps, monitoring refers to the supervision of specific metrics throughout the whole development process, from planning all the way to deployment and quality assurance. By being able to detect problems in the process, DevOps personnel can mitigate potential issues and avoid disrupting the software’s functionality.
DevOps monitoring aims to give teams the information to respond to bugs or vulnerabilities as quickly as possible.
DevOps Monitoring Metrics
To correctly implement the monitoring method, developers need to supervise a variety of metrics, including:
- Lead time or change lead time
- Mean time to detection
- Change failure rate
- Mean time to recovery
- Deployment frequency
What is Observability in DevOps?
Observability is a system where developers receive enough information from external outputs to determine its current internal state. It allows teams to understand the system’s problems by revealing where, how, and why the application is not functioning as it should, so they can address the issues at their source rather than relying on band-aid solutions. Moreover, developers can assess the condition of a system without interacting with its complex inner workings and affecting the user experience. There are a number of observability tools available to assist you with the software development lifecycle.
The Three Pillars of Observability
Observability requires the gathering and analysis of data released by the application’s output. While this flood of data can become overwhelming, it can be broken down into three fundamental data pillars developers need to focus on:
1. Logs
Logs refer to the structured and unstructured lines of text an application produces when running certain lines of code. The log records events within the application and can be used to uncover bugs or system anomalies. They provide a wide variety of details from almost every system component. Logs make the observability process possible by creating the output that allows developers to troubleshoot code by simply analyzing the logs and identifying the source of an error or security alert.
2. Metrics
Metrics numerically represent data that illustrates the application’s functioning over time. They consist of a series of attributes, such as name, label, value, and a timestamp that reveals information on the system’s overall performance and any incidents that may have occurred. Unlike logs, metrics don’t record specific incidents but return values representing the application’s overall performance. In DevOps, metrics can be used to assess the performance of a product throughout the development process and identify any potential problems. In addition, metrics are ideal for observability as it’s easy to identify patterns gathered from various data points to create a complete picture of the application’s performance.

3. Trace
While logs and metrics provide enough information to understand a single system’s behavior, they rarely provide enough information to clarify the lifetime of a request located in a distributed system. That’s where tracing comes in. Traces represent the passage of the request as it travels through all of the distributed system’s nodes.
Implementing traces makes it easier to profile and observe systems. By analyzing the data the trace provides, your team can assess the general health of the entire system, locate and resolve issues, discover bottlenecks, and select which areas are high-value and their priority for optimization.
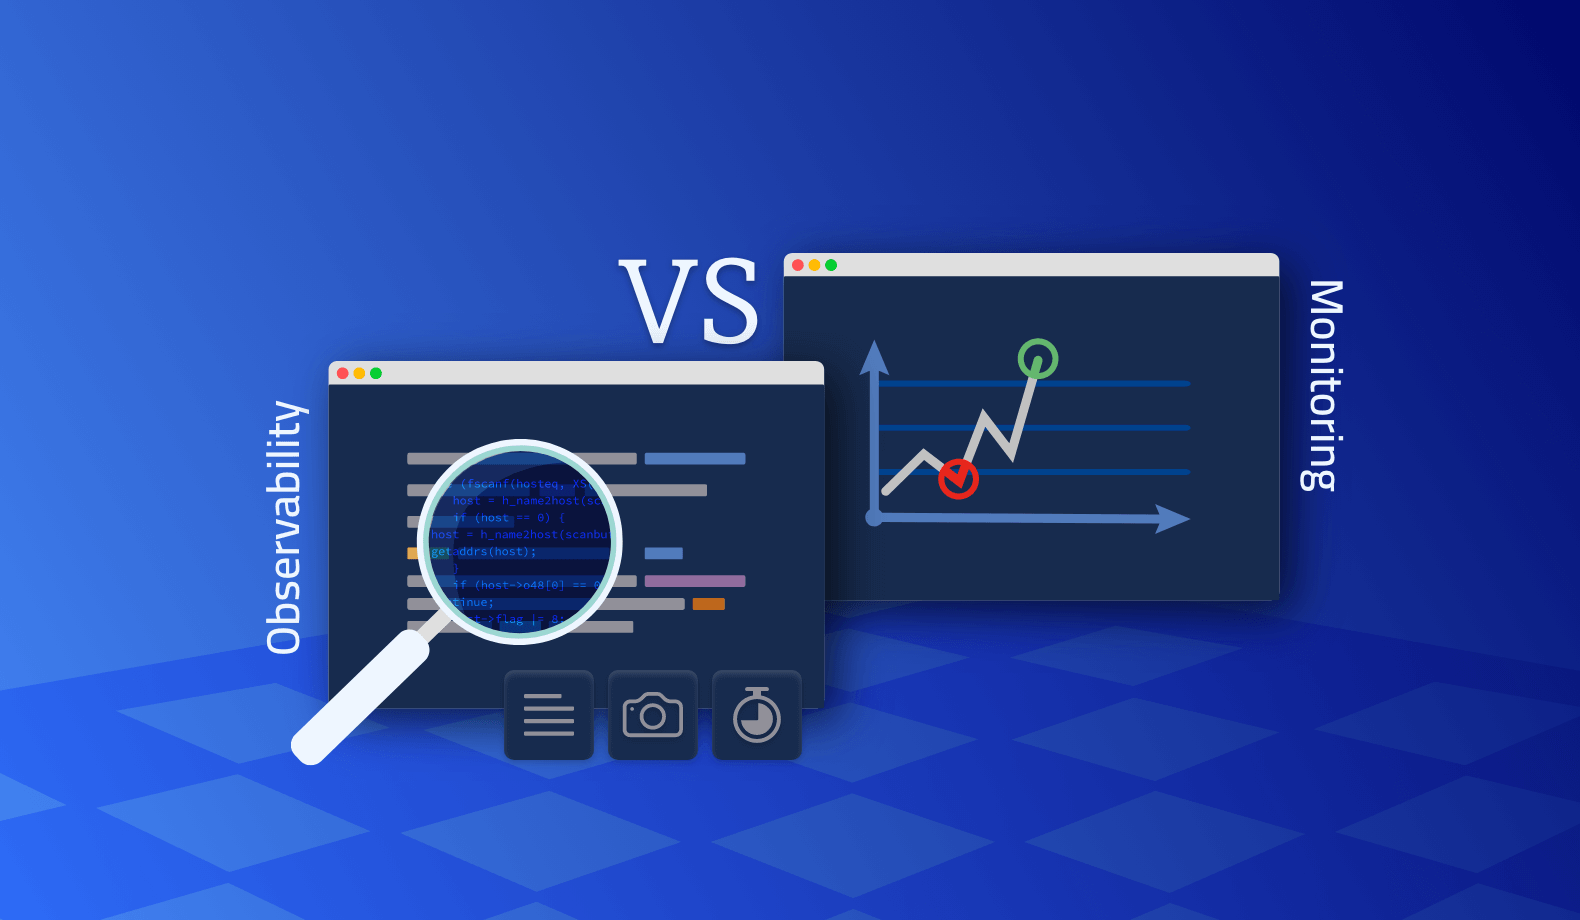
Monitoring vs. Observability: What’s the Difference?
We’ve compiled the below table to better distinguish between these two essential DevOps methods:
Monitoring Observability Practically any system can be monitored The system has to be designed for observation Asks if your system is working Asks what your system is doing Includes metrics, events, and logs Includes traces Active (pulls and collects data) Passive (pushes and publishes data) Capable of providing raw data Heavily relies on sampling Enables rapid response to outages Reduces outage duration Collects metrics Generates metrics Monitors predefined data Observes general metrics and performance Provides system information Provides actionable insights Identifies the state of the system Identifies why the system failed Observability vs. Monitoring: What do they have in common?
While we’ve established that observability and monitoring are entirely different methods, this doesn’t make them incomparable. On the contrary, monitoring and observability are generally used together, as both are essential for DevOps. Despite their differences, their commonalities allow the two methods to co-exist and even complement each other.
Monitoring allows developers to identify when there is an anomaly, while observability gives insights into the source of the issue. Monitoring is almost a subset of, and therefore key to, observability. Developers can only monitor systems that are already observable. Although monitoring only provides solutions for previously identified problems, observability simplifies the DevOps process by allowing developers to submit new queries that can be used to solve an already identified issue or gain insight into the system as it is being developed.
Why both are essential?
Monitoring and observability are both critical to identifying and mitigating bugs or discrepancies within a system. But to fully utilize the advantages of each approach, developers must do both thoroughly. Manually implementing and maintaining these approaches is an enormous task. Luckily, automated tools like Lightrun allow developers to focus their valuable time and skills on coding. The tool enables developers to add logs, metrics, and traces to their code without restarting or redeploying software in real-time, preventing delays and guaranteeing fast deployment.