How to debug Python in VSCode
Jun 06, 2022 / Updated: Mar 08, 2026

Python has become one of the most popular programming languages globally and is particularly popular in data science and artificial intelligence. Python’s popularity can be attributed to its ease of use and readability and the large ecosystem of libraries and frameworks built around it. Python is also popular among developers working on cloud-based applications, as they can use it to orchestrate complex workflows.
Netflix, for example, is one of the largest online streaming services in the world and relies heavily on Python for its content management system and recommendation engine. Python is also used extensively throughout Netflix’s back-end infrastructure, from system administration tools to deployment scripts. Major companies and institutions such as IBM, Pixar, Facebook, Spotify, and NASA also use Python.
What is Python?
Python is a programming language permeating every industry due to its versatility and large developer community. It is a general-purpose programming language employed in software development, scripting, and automation. It is also popular for scientific computing and data analysis, as it has many libraries and tools for these tasks.
Python is easy to learn for beginners because of its high readability and simple syntax construction. According to Statista, Python claimed the top spot for the most popular programming language in early March 2020. The open-source language also has an estimated market value of over $10 billion. In addition, TechRepublic reports Python as one of the most in-demand and employable skill sets from 2021 onwards.
While knowing how to code in Python is a great skill to have, knowing how to debug Python to figure out what’s wrong with your code is equally important.
Here is a guide on using VSCode to help you debug your Python code.
Debugging Python in VSCode — step by step guide
Debugging is a staple requirement of every programming job. To debug means to walk through the program step-by-step to figure out the origins of an error. When we need to debug Python, it’s usually because something is not working as expected.
In this tutorial, we will go over how to debug Python using VSCode’s built-in debugging tools to help us figure out and pinpoint where our errors are originating.
Prerequisites
For this tutorial, here are the prerequisites and assumptions:
- You have a working knowledge and understanding of Python
- You have a Python interpreter installed
Opening a Python project in VSCode
If you don’t have a Python project to debug, here is one we prepared for you. It is a simple piece of Python with an error built into the do_something_cool method.
 class User:
    def __init__(self, name, email):
        self._name = name
        self._email = email

    def get_name(self):
        return self._name

    def get_email(self):
        return self._email

    def do_something_cool(self):
        print ("Sign up to Lightrun " + self._namee)

    def __str__(self):
        return self._name + " , " + self._email

    users = [ User("Lightrun Demo", "help@lightrun.com"), User("Debugger", "debugger@debugger.com")]

    for user in users:
        user.do_something_cool()
Let’s get into the process of debugging this code.
Initial configuration for Python debugging
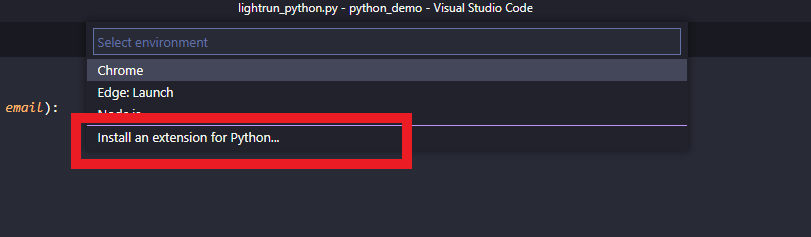
Start by clicking on the debug icon on the left-hand panel in your VSCode. Click Create a launch.json file, which will give you a drop-down of all your currently installed debuggers.
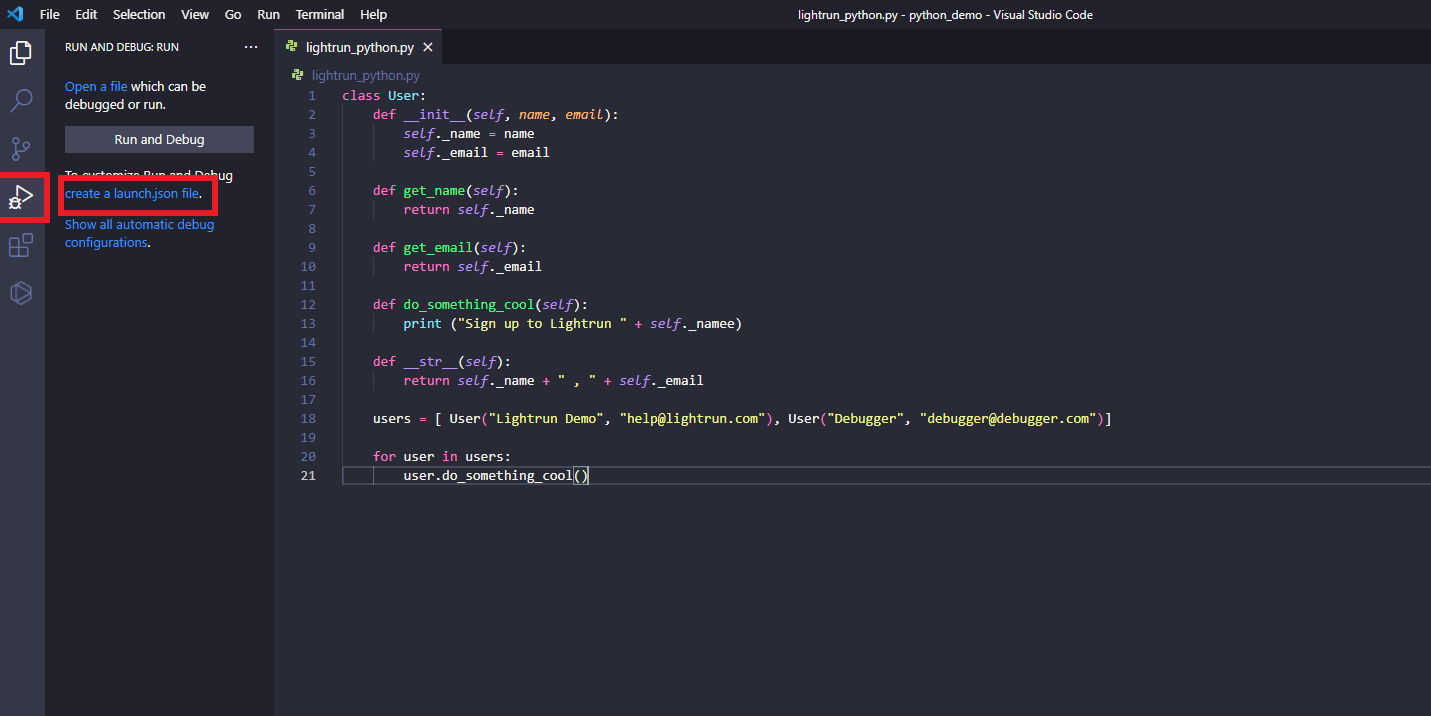
By default, a Python debugger is not installed in VSCode. You can identify this in the missing Python option in the dropdown pictured above.
To download and install a Python debugger, you can do one of the following:
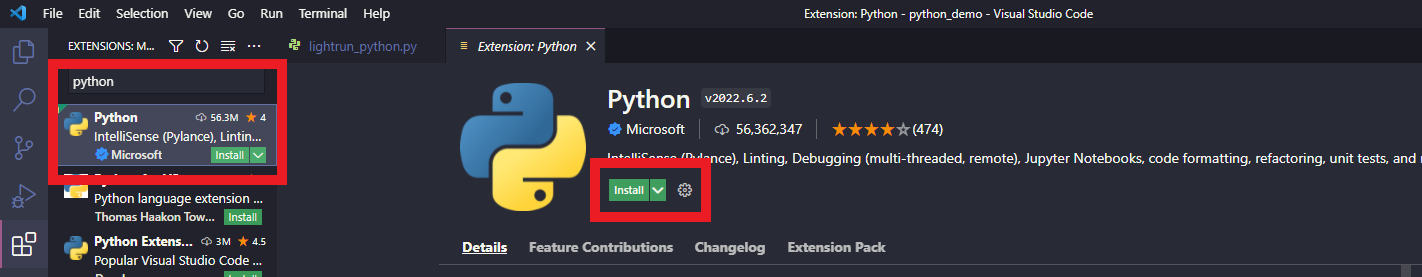
- Go back to the left-hand menu and click the Extensions button, then type Python in the search box, and a list of results should show up.
- Click Install an extension for Python.
Regardless of what you choose, it will bring up similar, if not the same results. Select the first one, Microsoft’s official Python extension for Visual Studio Code. Click the Install button to add it to your VSCode instance. (Sidenote: if you have time, check out other extensions for Python in VS Code.)
Under normal circumstances, you shouldn’t have to restart VSCode after installing the Python debug extension.
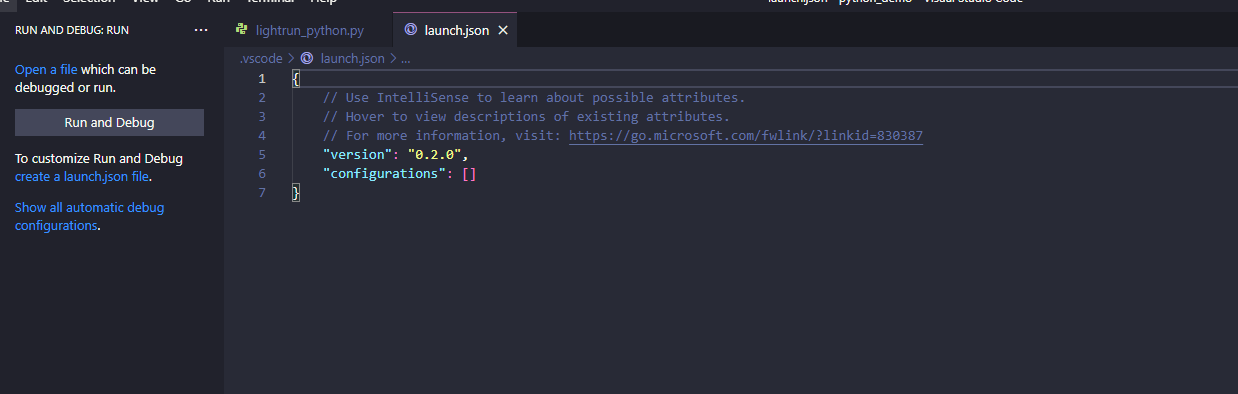
Go back to the Debug menu. When you click Create a launch json file again, a Python option should become available. Alternatively, VSCode may simply make the selection for you and automatically generate a JSON file.
Debugging current Python file
Open up the Python file you want to debug. In our case, it is the file with the code example above. A faded red dot will appear when you hover over on the left-hand side of the line number. If you click on this dot, it will set a breakpoint.
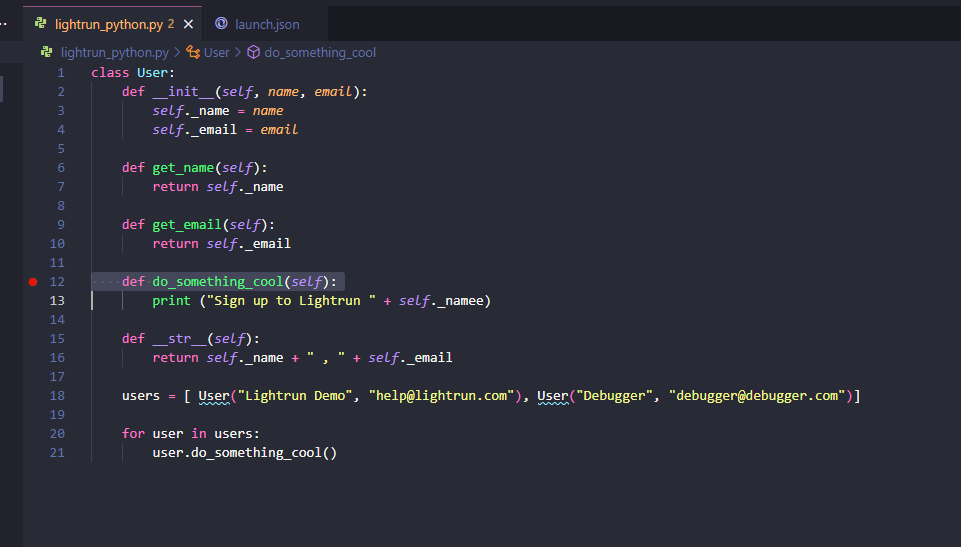
A breakpoint is a point in the code where the program’s execution will stop temporarily so that the program’s state can be examined. Breakpoints are helpful for debugging purposes because they allow the programmer to check the values of variables and see how the program is executing at that point.
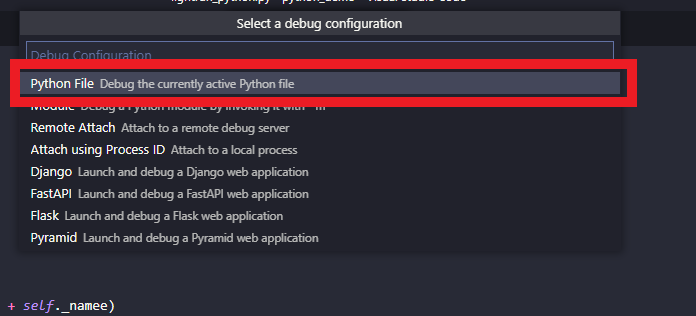
When you click Run and Debug for the first time, you will get the option to select a debug configuration. For this tutorial, select Python File.
When you click the Play button located in the top left above the VARIABLES panel, the Python debugger will run through the code and stop at the breakpoint.
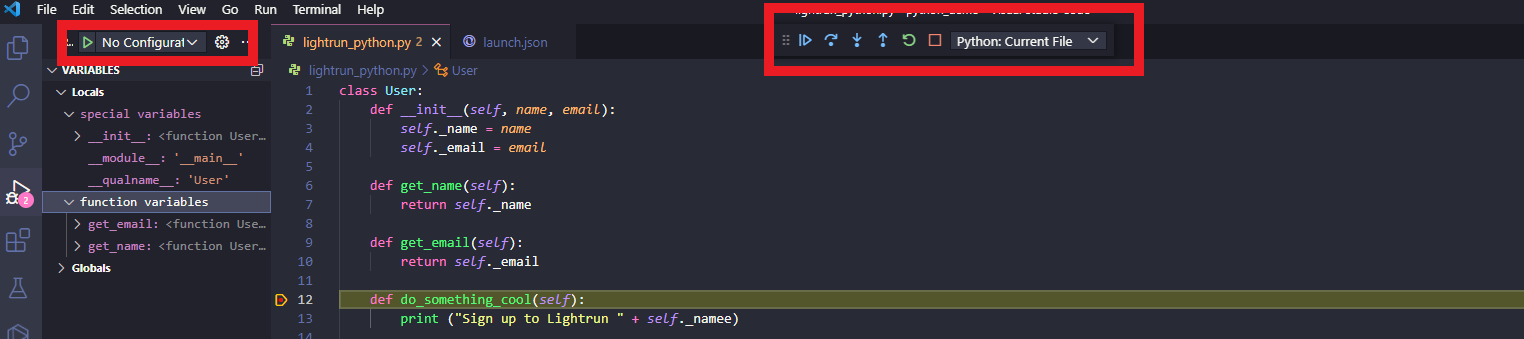
A debugging toolbar will also become available at this point. The debugging toolbar contains buttons that let you go forward, backward, and jump into different parts of the code based on where you currently are in your breakpoint. Metadata about your code will also appear in the VARIABLES panel, where locals and globals can be watched and monitored for changes.
Here is a rundown on what each icon in the toolbar does:
- Continue (F5) will run past the breakpoint and continue with the rest of the program until it hits the next breakpoint.
- Step over (F10) will take the debugger down to the following line.
- Step into (F11) will take the debugger into the following function.
- Step out (F12) will take the debugger out of the function and into the next step.
- Restart (Ctrl+Shift+F5) will restart the entire debugging process.
- Stop (shift+F5) will stop the debugging process and exit it.
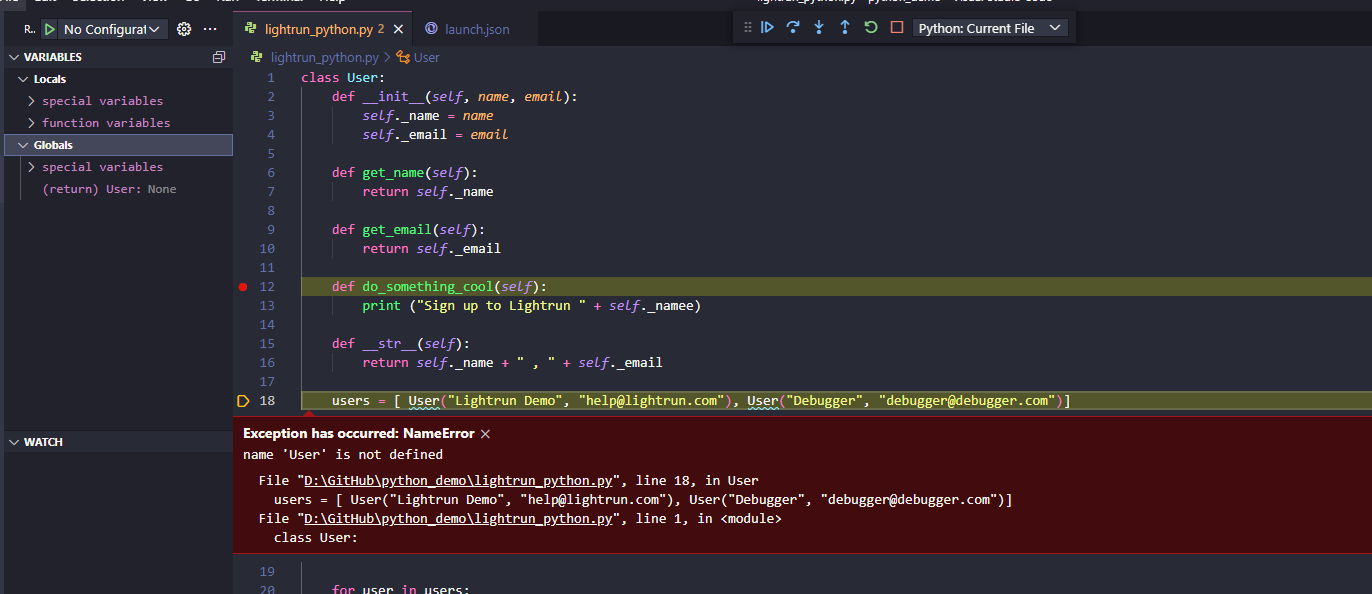
Let’s run our debugger through, and we see that the variable for name doesn’t exist.
Debugging in production with Lightrun
As you can see above, debugging a simple Python script in your local VSCode is fairly easy. Same goes for debugging Node.js in VSCode or debugging Java in IntelliJ IDEA.
What if you have a problem that you can’t reproduce in your local environment? In a real-world development setting, especially with large applications, bugs often only show up under load in production environments. How do you debug that?
Fortunately, there are now tools available to make debugging in production possible and painless.
Take a look at Lightrun: our next-gen remote debugger for your production environment. With Lightrun, you can inject logs without changing code or redeploying, or add snapshots: breakpoints that don’t stop your production application. Lightrun supports Python, Java, and Node.js applications, and you can start using it for free.