Python Remote Debugging with VS Code and debugpy
Sep 08, 2021 / Updated: Mar 08, 2026
Debugging is the process of identifying, analyzing and removing errors in the software. It is a process that can start at any stage of the software development, even as early as the software has been written.
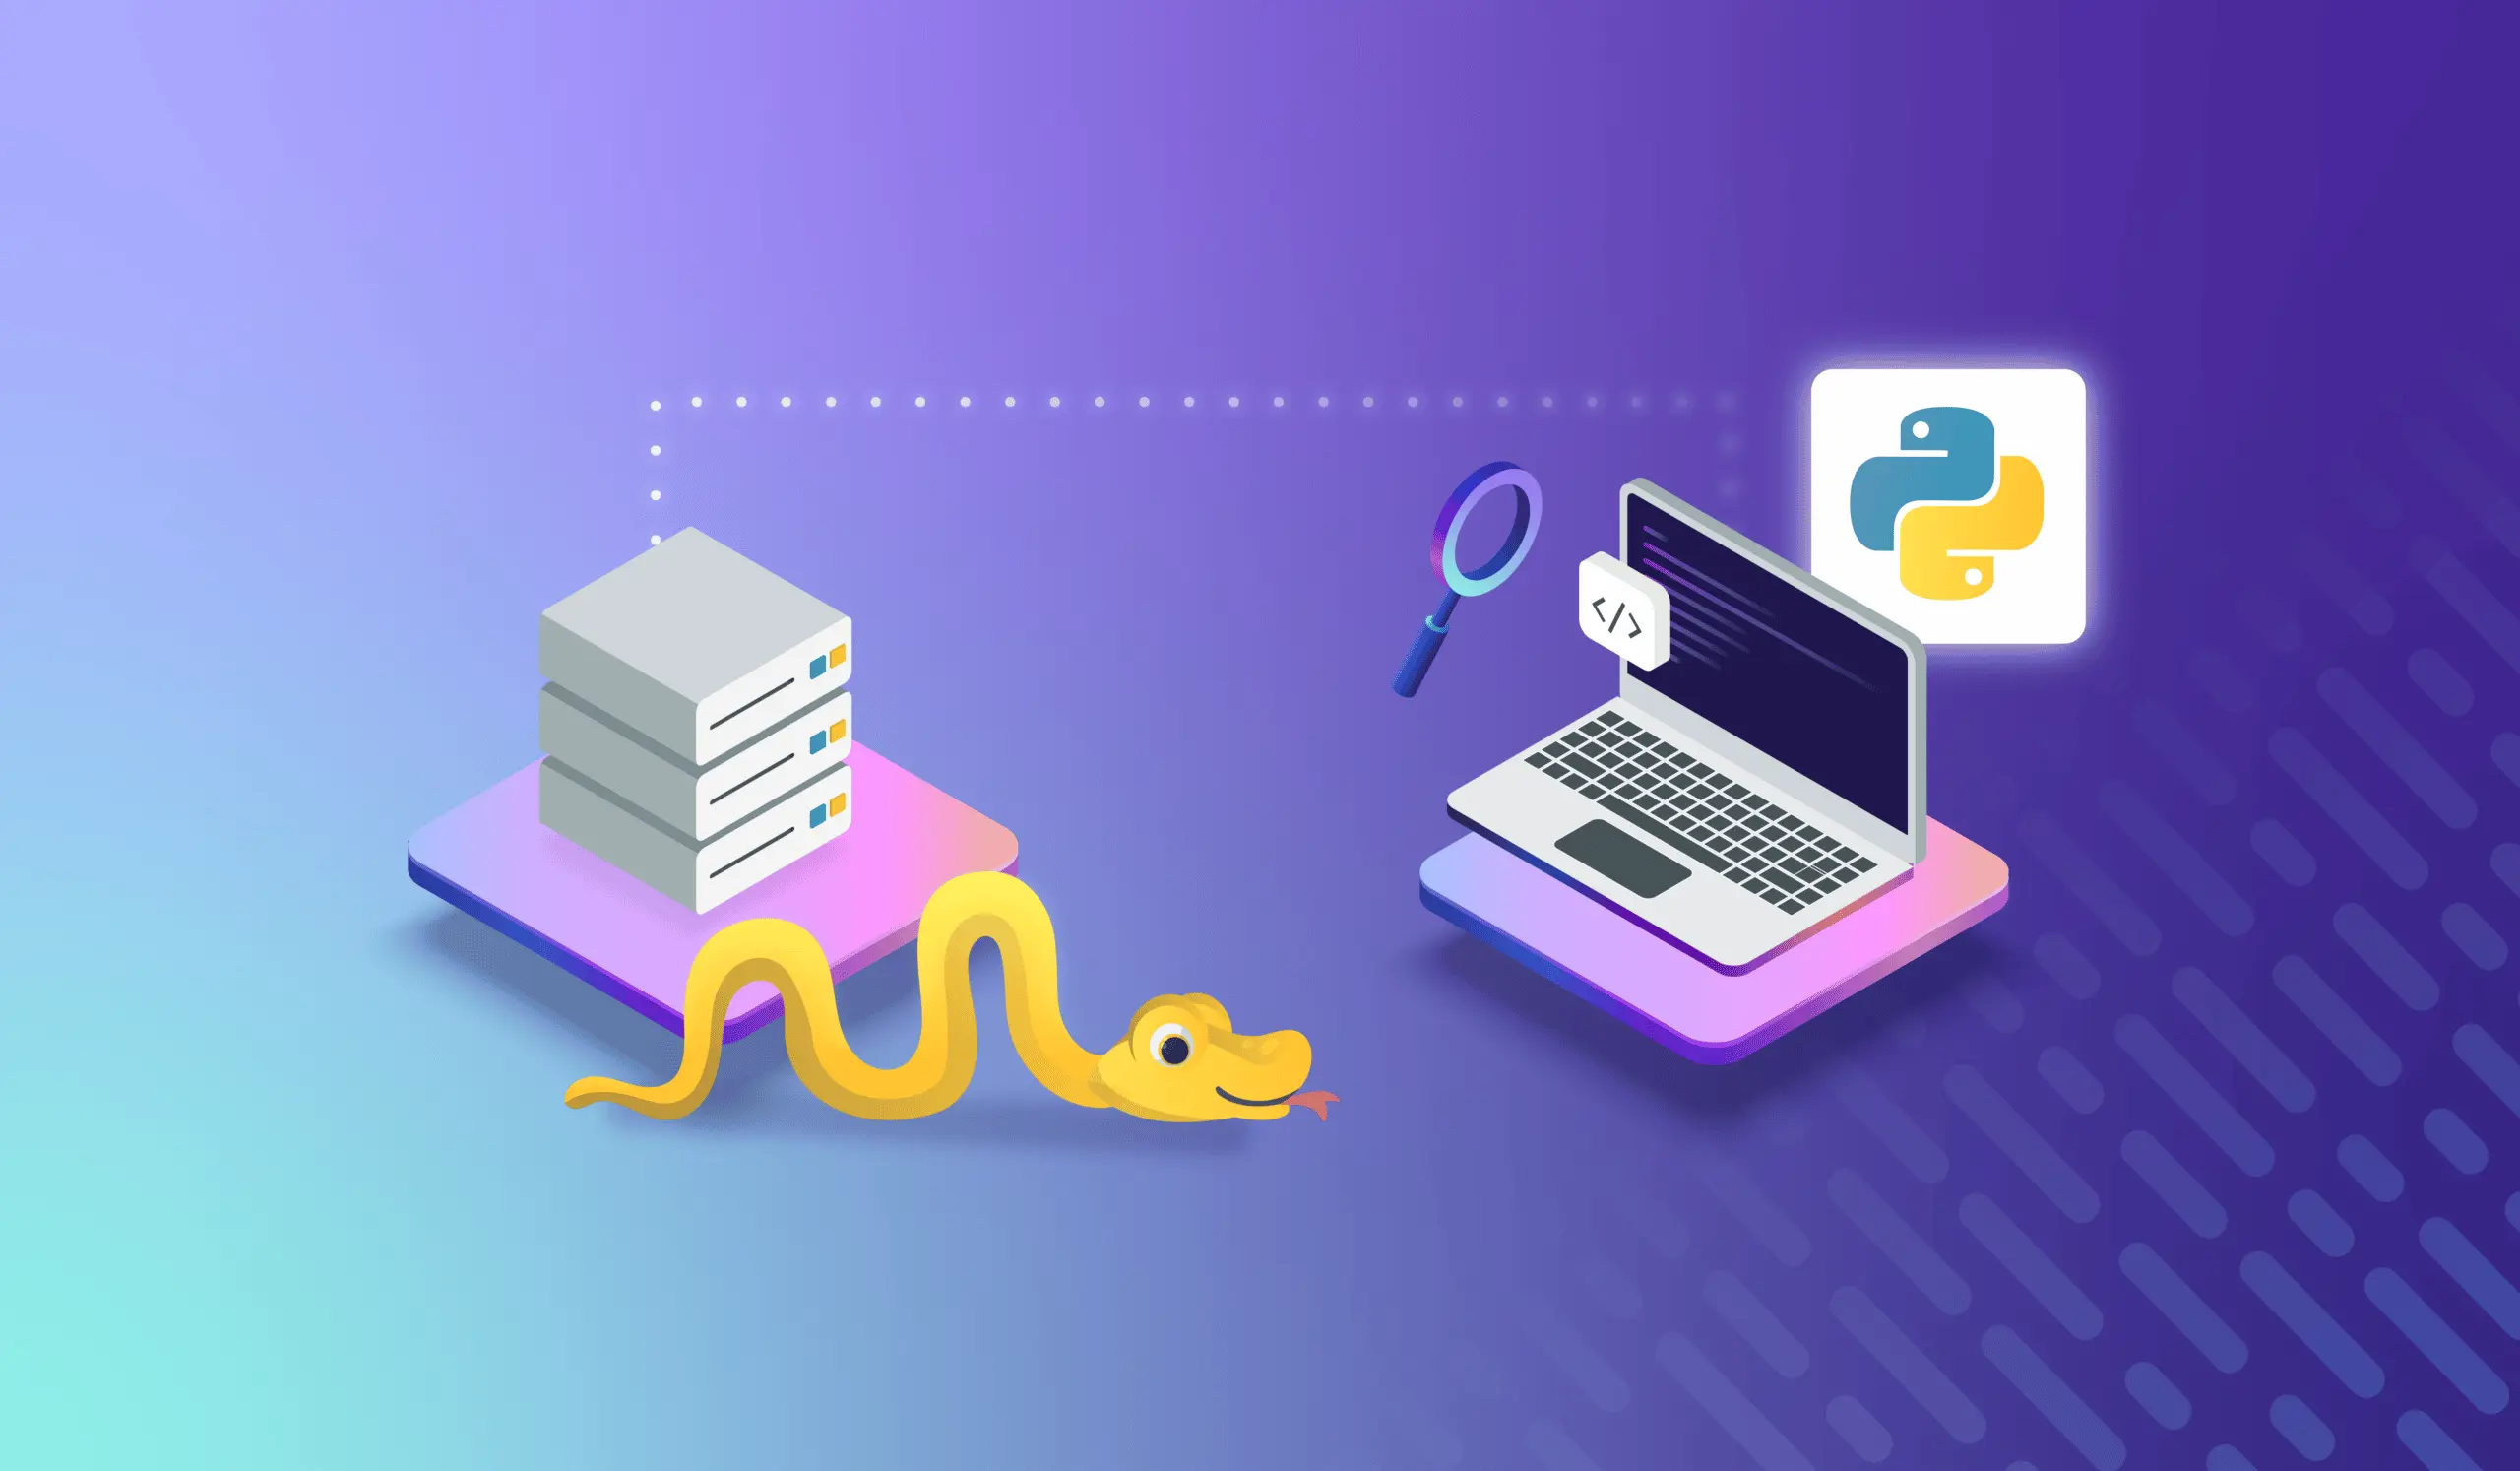
Sometimes, remote debugging is necessary. In the simplest terms, remote debugging is debugging an application running in a remote environment like production and staging. To perform remote debugging, you need to be able to remotely connect to a running application from your local development environment.
This article will focus on a debugging strategy known as forward analysis for Python remote debugging. We’ll cover the different tools and libraries such as debugpy that will allow you to debug a live application remotely. We’ll go over the setup and configuration steps for remote debugging in Visual Studio Code, one of the most accessible and powerful IDEs available.
Note that setting up this Python remote debugging workflow takes some effort, especially when applied to real-world production applications. If you want to minimize the hassle and establish a much smoother production debugging experience from VS Code or PyCharm, consider setting up a Lightrun account.
Debugging Basics
There are a couple of strategies you can employ when debugging issues.
- Backward analysis: Tracing the problem from an error log or message in order to identify the region of the code with the failure.
- Forward analysis: Tracing the problem using breakpoints at different steps of your program’s execution.
From there, there’s a basic workflow to follow.
- Identify the error: Error reports might be specific or vague depending on the part of the software, environment, and stage of development they show up on. The first step to effective debugging is to make sure you identify the actual error.
- Find the error location: Once you have identified the error correctly, you need to narrow down the code’s location to where the bug is present.
- Analyze the error: Now that you have a better idea of where the error might be located, your next step is to analyze the conditions and the underlying cause to solve the issue.
- Fix and validate: Finally, you need to take steps to change the code and validate that your solution is correct. Typically, this is done by writing unit tests that validate the conditions of the original software defect.
Prerequisites
For this tutorial, you will need Python 3, venv, Docker Compose, debugpy, and the Flask web framework. You will also need Visual Studio Code (VS Code), preferably with the official Python extension installed. Feel free to install other VS Code Python extensions as you see fit.
You’ll use a simple sudoku script as your debugging target. To download the demo application, follow this link. Alternatively, you can also use your own target Python 3 application, as the libraries you’ll use should be compatible.
Python Remote Debugging Architecture
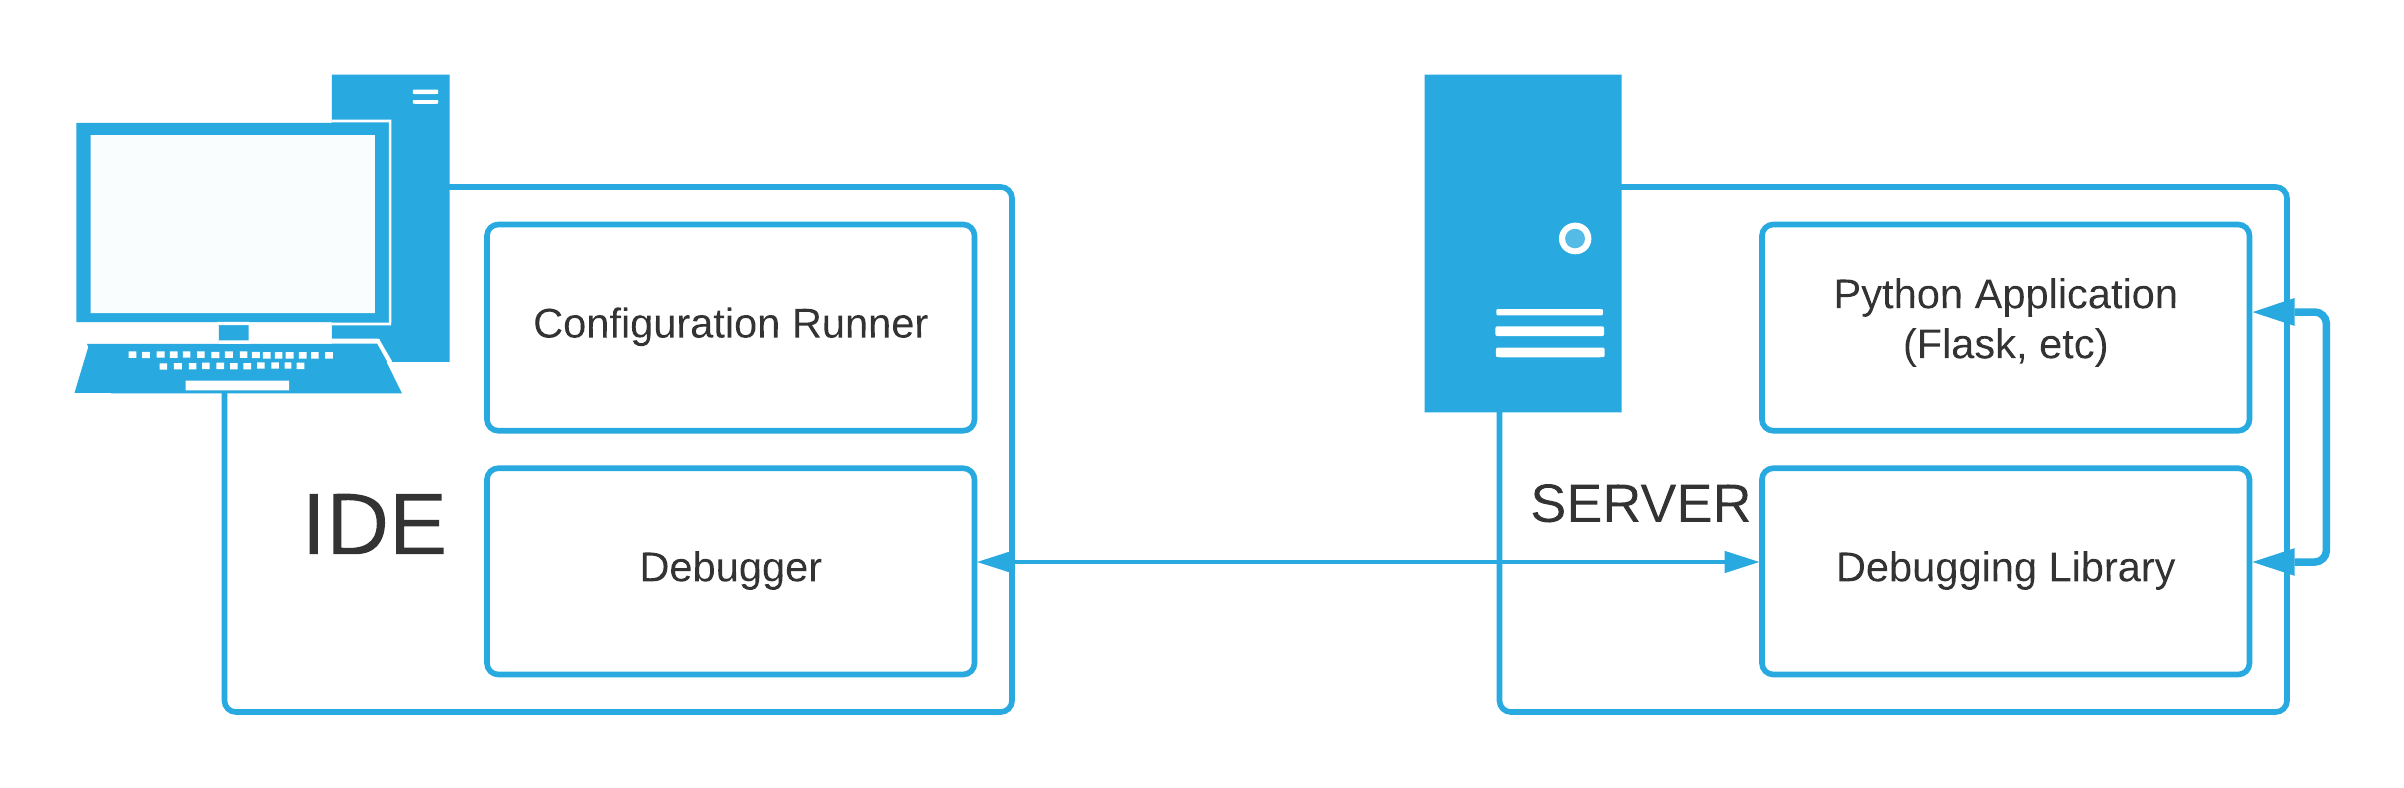
At a high level, a remote debugging process requires:
- A connection between the server and your local development environment.
- A debugging package installed on the remote application compatible with the IDE.
- An IDE configured to allow for Python remote debugging.
- Matching code between the IDE and the version deployed on the server.
Remote debugging has several benefits, but mainly it allows you to inspect and debug the application directly on the system. In many situations, this might be the only option available to developers to trace a software defect.
Start with debugging your sudoku solver locally to get familiar with the debugging tools and interface. Later, you’ll modify that initial configuration for Python remote debugging.
Setting Up Local Debugging with VS Code
The official Python extension provided by VS Code supports debugging several types of Python applications, from simple scripts like your sudoku solver to more complex applications like Flask and Django.
Create the Initial Configuration
With the sudoku solver script open, click the Run tab on the sidebar.
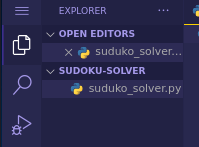
A dialog asks you to customize the Run and Debug configuration.
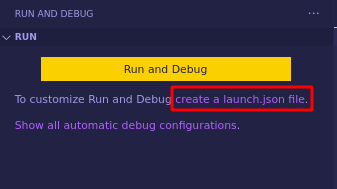
Click create a launch.json file to open a dialog where you will select the debug configuration.
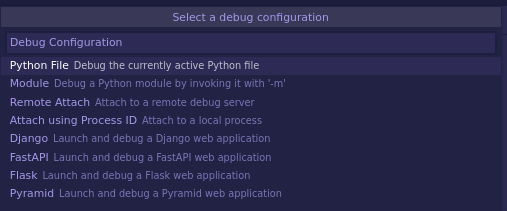
Out of the box, Visual Studio Code gives you a couple of presets to start, including Django and Flask. Go ahead and select the Python file configuration from the dropdown menu. VS Code will immediately create and open a sample launch.json configuration file.
Additionally, the sidebar will change to show the following sections:
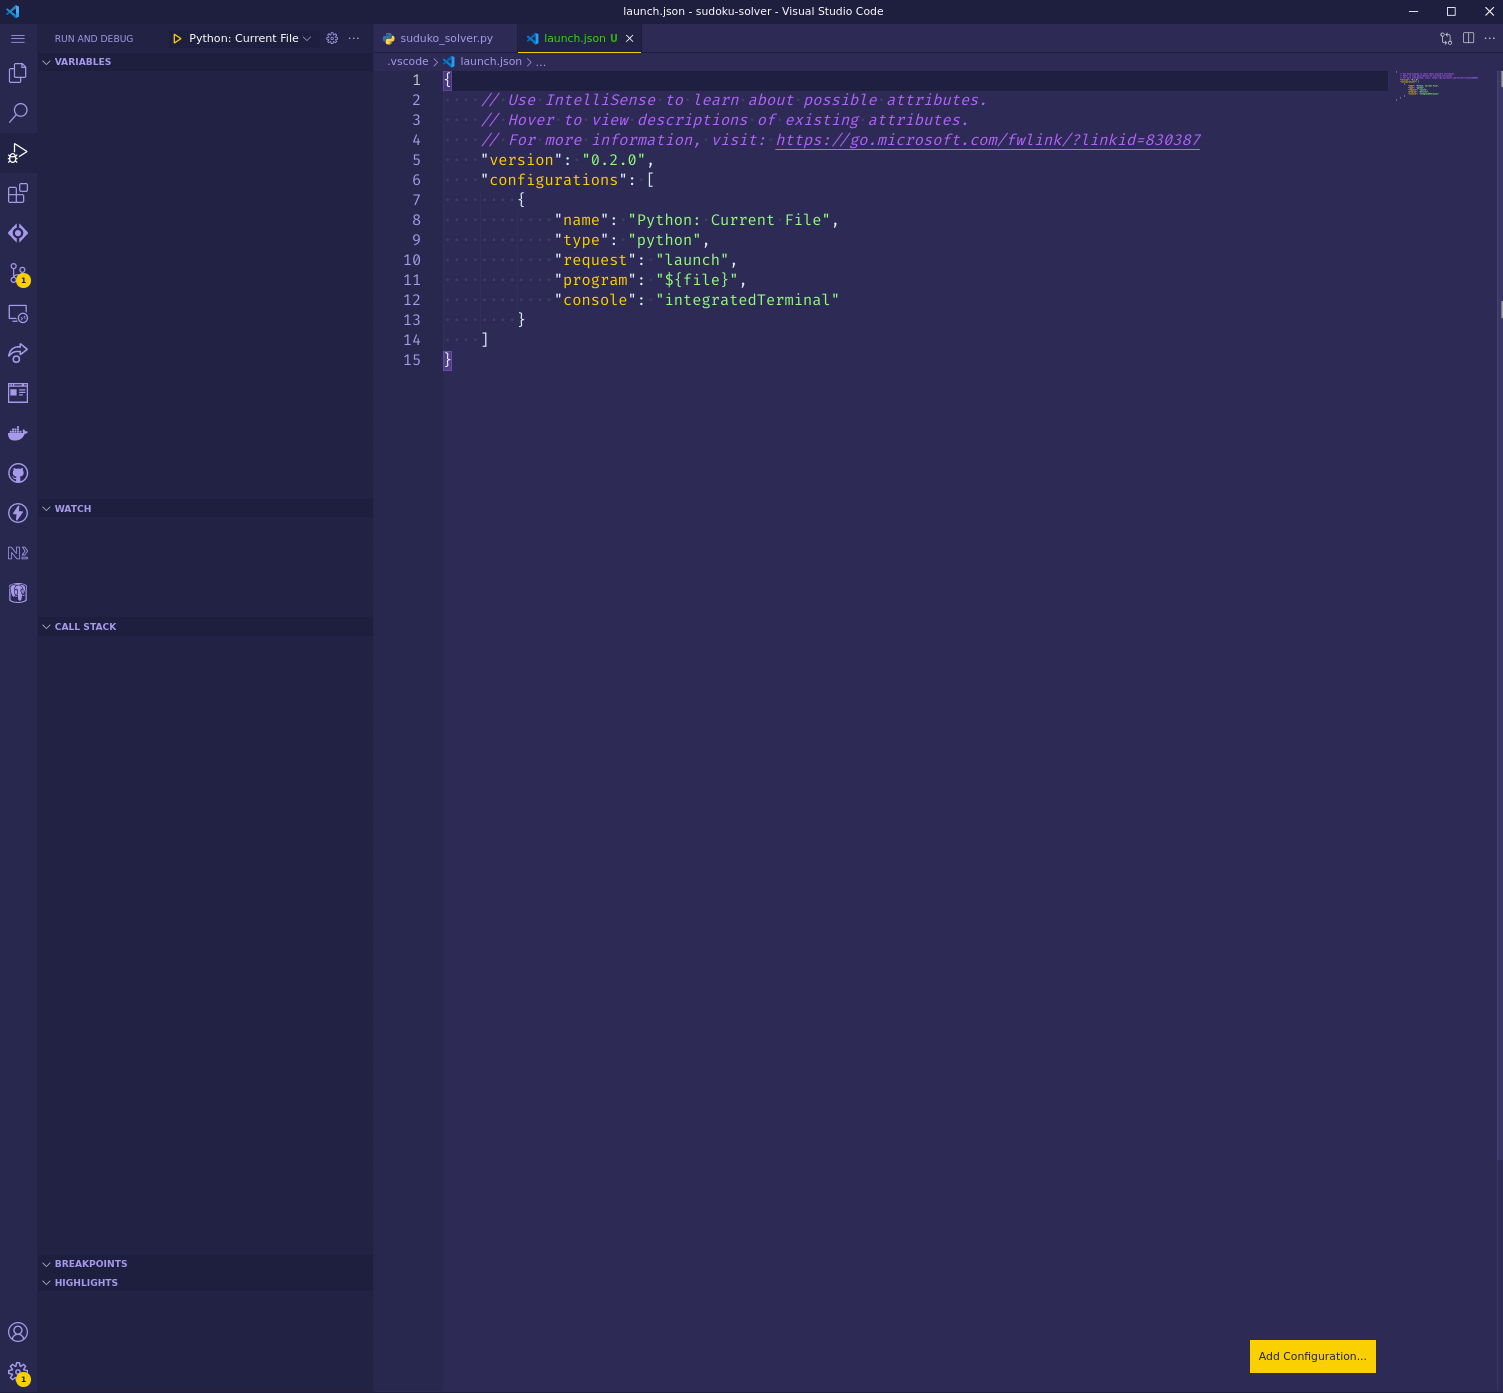
- Variables: variable values and expression evaluation from the selected stack frame in the Call Stack section.
- Watch: the list of expressions to watch, helpful in setting conditional breakpoints.
- Call Stack: the order in which methods, modules, and functions are getting called.
- Breakpoints: defined stopping or pausing places during application execution.
Let’s take a closer look and define a couple of breakpoints in your file:
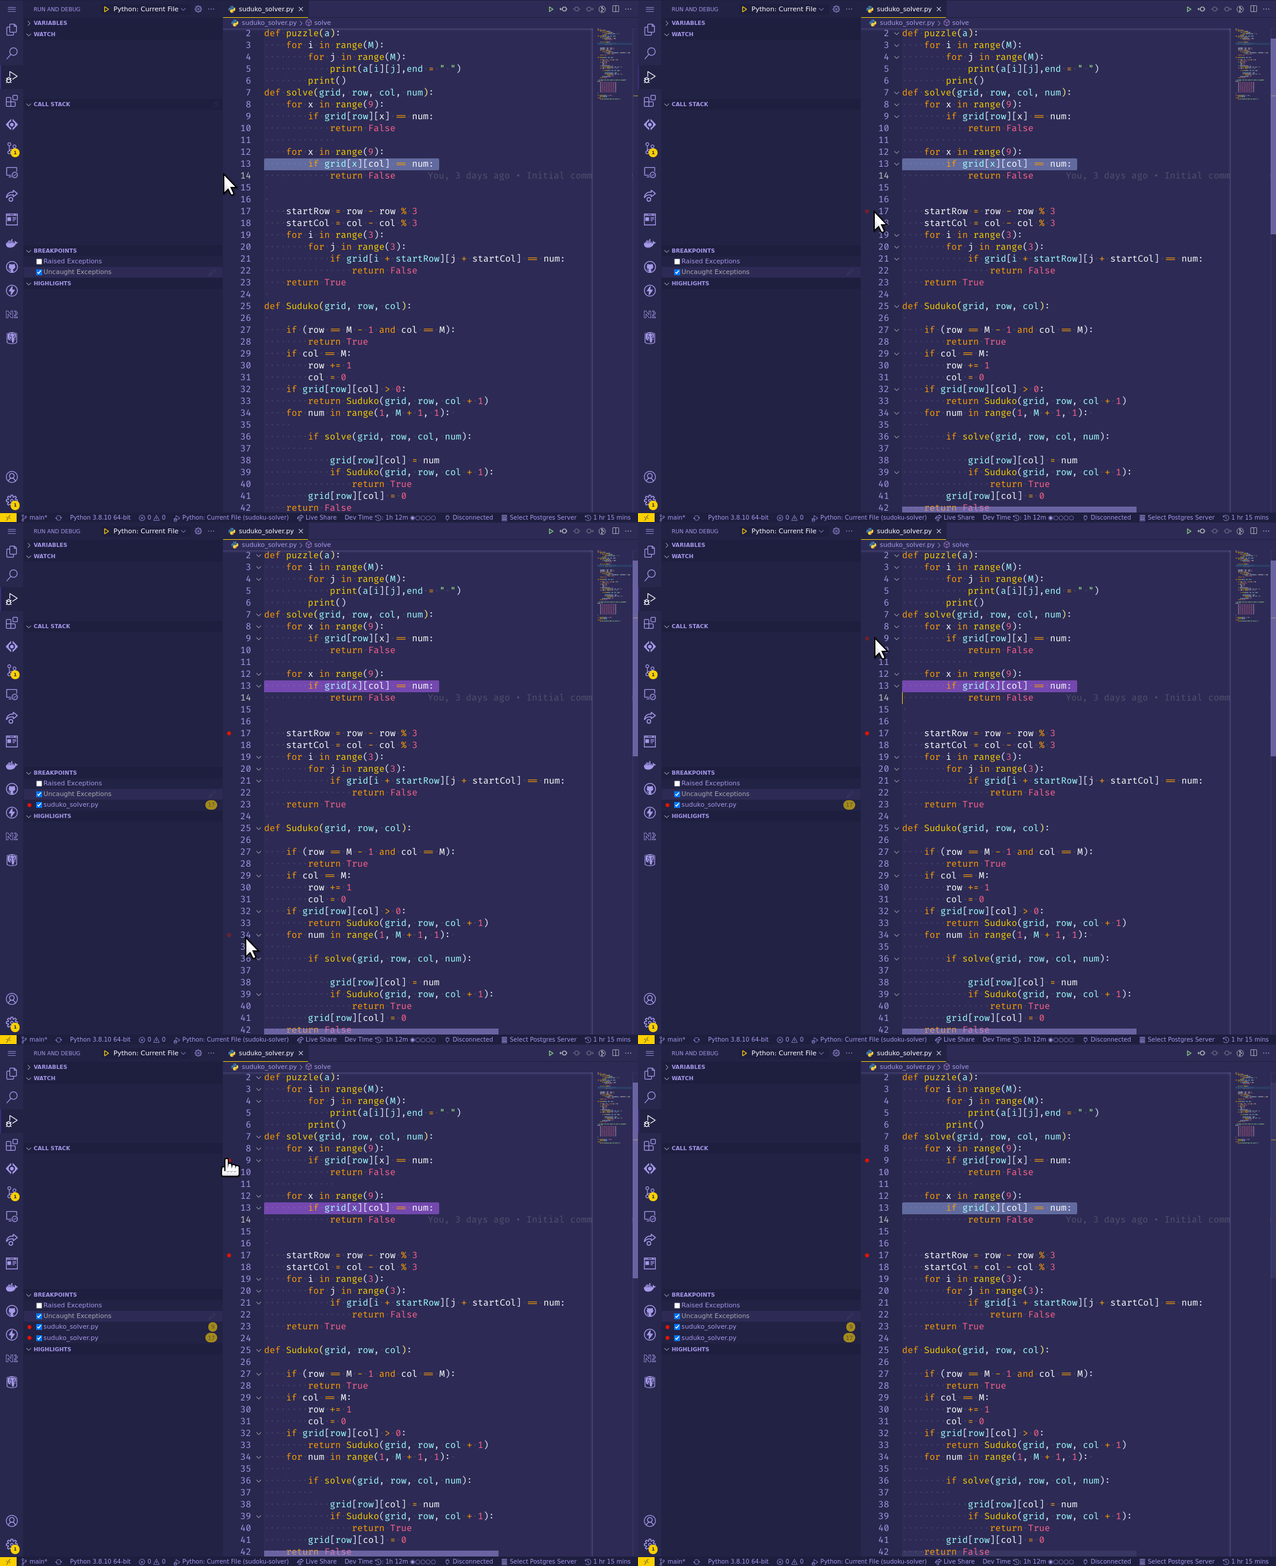
Finally, go ahead and run the program through the debug configuration.
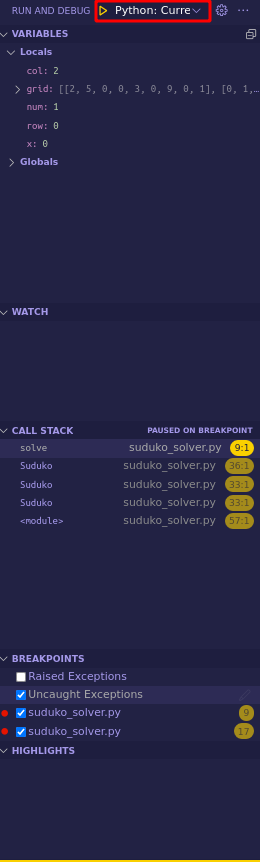
The program will initialize and stop at your first breakpoint on line 9 and correctly show the call stack that leads to the program’s execution. Additionally, you can inspect all the variables and their state at the current step in the program execution.
How to Set Up Python Remote Debugging
Now, with a better understanding of your IDE’s overall layout and debugging capabilities, you can move forward and set up for Python remote debugging. In order to properly illustrate the capabilities and value of remote debugging, you need a more complex application than a simple sudoku solver. Fortunately, Microsoft has a sample Flask project that you can leverage for your tutorial.
The Flask Sample Project has a simple web app and a matching Docker file that will allow you to simulate the Python remote debugging scenario. If you’d like to set up and build this application from scratch, feel free to visit the official tutorial.
Step 1: Application and Docker Setup
Start by checking out the repository and setting up the sample project:
git clone git@github.com:microsoft/python-sample-vscode-flask-tutorial.git
cd python-sample-vscode-flask-tutorial
python3 -m venv env
source ./env/bin/activate
python3 -m pip install --upgrade pip
pip install -r requirements.txt
code .
The above Bash snippet performs the following actions:
- Clone the official VS Code Flask tutorial.
- Create a Python Virtual Environment.
- Activate the virtual environment.
- Make sure pip is up to date.
- Install required libraries specified in
requirements.txt. - Open VS Code. This will automatically load the Flask project with the active directory set to
python-sample-vscode-flask-tutorial.
Note that on the first run, VS Code will ask you to select the relevant Python interpreter. Make sure to select the one from your virtual environment.
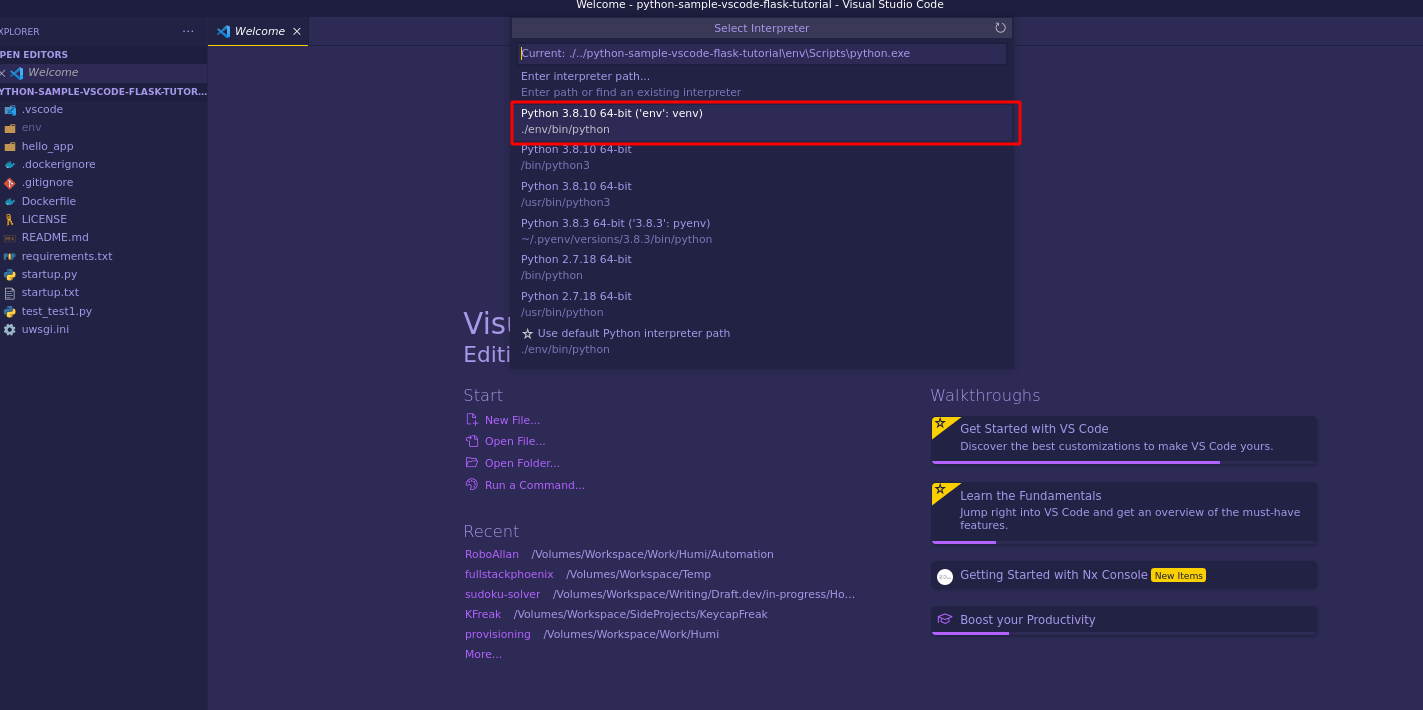
Next, make a few changes inside the python-sample-vscode-flask-tutorial project to simulate a remotely running Python application with Docker. Open the Dockerfile and uncomment the last three lines of the file.
# Pull a pre-built alpine Docker image with NGINX and Python 3 installed
FROM tiangolo/uwsgi-nginx:python3.8-alpine-2020-12-19

# Set the port on which the app runs; make both values the same.
#
# IMPORTANT: When deploying to the Azure App Service, go to the App Service on the Azure
# portal, navigate to the Applications settings blade, and create a setting named
# WEBSITES_PORT with a value that matches the port here (the Azure default is 80).
# You can also create a setting through the App Service Extension in VS Code.
ENV LISTEN_PORT=5000
EXPOSE 5000

# Indicate where uwsgi.ini lives
ENV UWSGI_INI uwsgi.ini

# Tell NGINX where static files live. Typically, developers place static files for
# multiple apps in a shared folder, but for the purposes of this tutorial you can use the one
# app's folder. Note that when multiple apps share a folder, you should create subfolders
# with the same name as the app underneath "static", so there aren't any collisions
# when all those static files are collected together.
ENV STATIC_URL /hello_app/static

# Set the folder where uwsgi looks for the app
WORKDIR /hello_app

# Copy the app contents to the image
COPY . /hello_app

# If you have additional requirements beyond Flask (which is included in the
# base image), generate a requirements.txt file with pip freeze and uncomment
# the next three lines.
COPY requirements.txt /
RUN pip install --no-cache-dir -U pip
RUN pip install --no-cache-dir -r /requirements.txt
Next create a docker-compose.yml that will allow you to launch your Docker container.
./python-sample-vscode-flask-tutorial/docker-compose.yml

# docker-compose.yml
version: "3.4"

services:
  flask-server:
    image: flask
    build:
      context: .
      dockerfile: Dockerfile
    ports:
      - 5000:5000
    volumes:
      - .:/hello_app:cached
To verify that you can run your Flask application, execute the following command and visit localhost:5000:
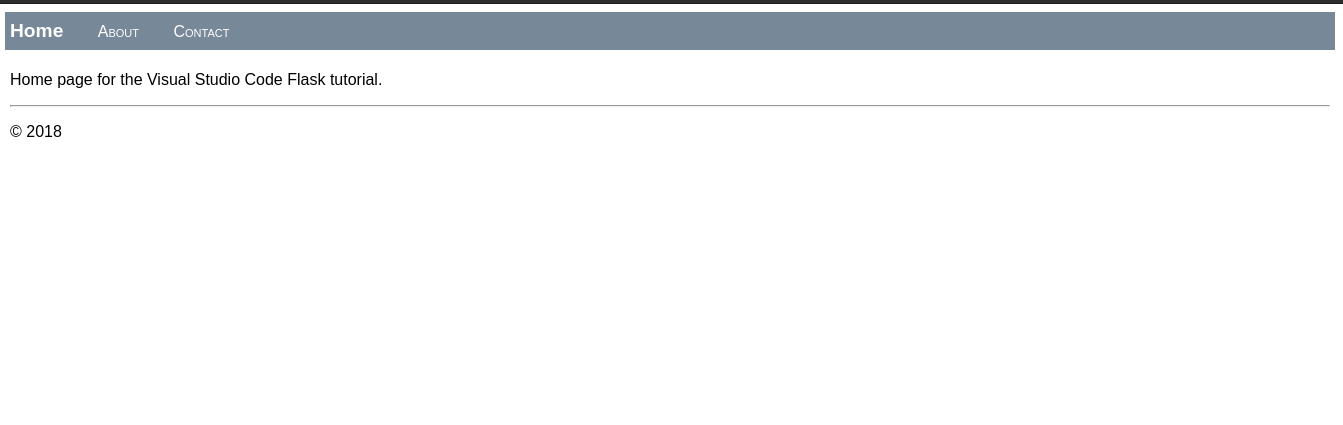
docker-compose upIf everything is working correctly, you should see the following in your browser:
Step 2: Debugger Setup
Now that you have the sample Flask application up and running, set up VS Code for remote debugging.
As before, create a launch configuration for attaching to your Python remote debugger. You can do this by adding or modifying your launch.json file as follows:
./python-sample-vscode-flask-tutorial/.vscode/launch.json

{
  "configurations": [
        {
            "name": "Python: Attach",
            "type": "python",
            "request": "attach",
            "localRoot": "${workspaceFolder}",
            "remoteRoot": "/hello_app",
            "port": 9000,
            "secret": "my_secret",
            "host": "localhost"
        },
  ]
}
Make sure the localRoot and remoteRoot mappings are correct to your project setup and system. These mappings are used to link the files being executed on the remote server with your local copy.
Install debugpy
Next, install and set up debugpy, a Python module that allows you to create a debugger for your Python applications. To install debugpy, make sure to add debugpy to requirements.txt:
./python-sample-vscode-flask-tutorial/requirements.txt

Flask
debugpy
Instantiate debugpy Inside Your Application
Create the following file inside your hello_app application:
./python-sample-vscode-flask-tutorial/hello_app/debugger.py

from os import getenv

def initialize_debugger():
    if getenv("DEBUG") == "True":
        import multiprocessing

        if multiprocessing.current_process().pid > 1:
            import debugpy

            debugpy.listen(("0.0.0.0", 9000))
            print("Debugger is ready to be attached, press F5", flush=True)
            debugpy.wait_for_client()
            print("Visual Studio Code debugger is now attached", flush=True)
Instantiate the Debugger
./python-sample-vscode-flask-tutorial/hello_app/webapp.py

# Entry point for the application.
from . import app    # For application discovery by the 'flask' command.
from . import views  # For import side effects of setting up routes.
from . import debugger  # For import side effects of setting up debugger.

# Time-saver: output a URL to the VS Code terminal so you can easily Ctrl+click to open a browser
# print('https://127.0.0.1:5000/hello/VSCode')


./python-sample-vscode-flask-tutorial/hello_app/__init__.py

from flask import Flask  # Import the Flask class
from .debugger import initialize_debugger

initialize_debugger()

app = Flask(__name__)    # Create an instance of the class for your use
Expose the Debugging Port
Finally make sure your debugging port is exposed on your Docker container. Open docker-compose.yml and add the following line:
# docker-compose.yml
version: "3.4"

services:
  flask-server:
    image: flask
    build:
      context: .
      dockerfile: Dockerfile
    ports:
      - 5000:5000
      - 9000:9000
    volumes:
      - .:/hello_app:cached
This will allow you to attach your remote debugging session to the container.
Launch the Container with a Debugger Enabled
Next, launch your Docker container in debug mode. The main thing you’re doing here is passing the DEBUG variable, which will then instantiate your debugpy listener.
docker-compose run --rm -e FLASK_APP=hello_app/webapp.py -e FLASK_ENV=development -e DEBUG=True --service-ports flask-server flask run --host 0.0.0.0Finally, the last step is to attach to a debug session directly from Visual Studio Code. The following is a GIF of the debugger working against the Python remote application:
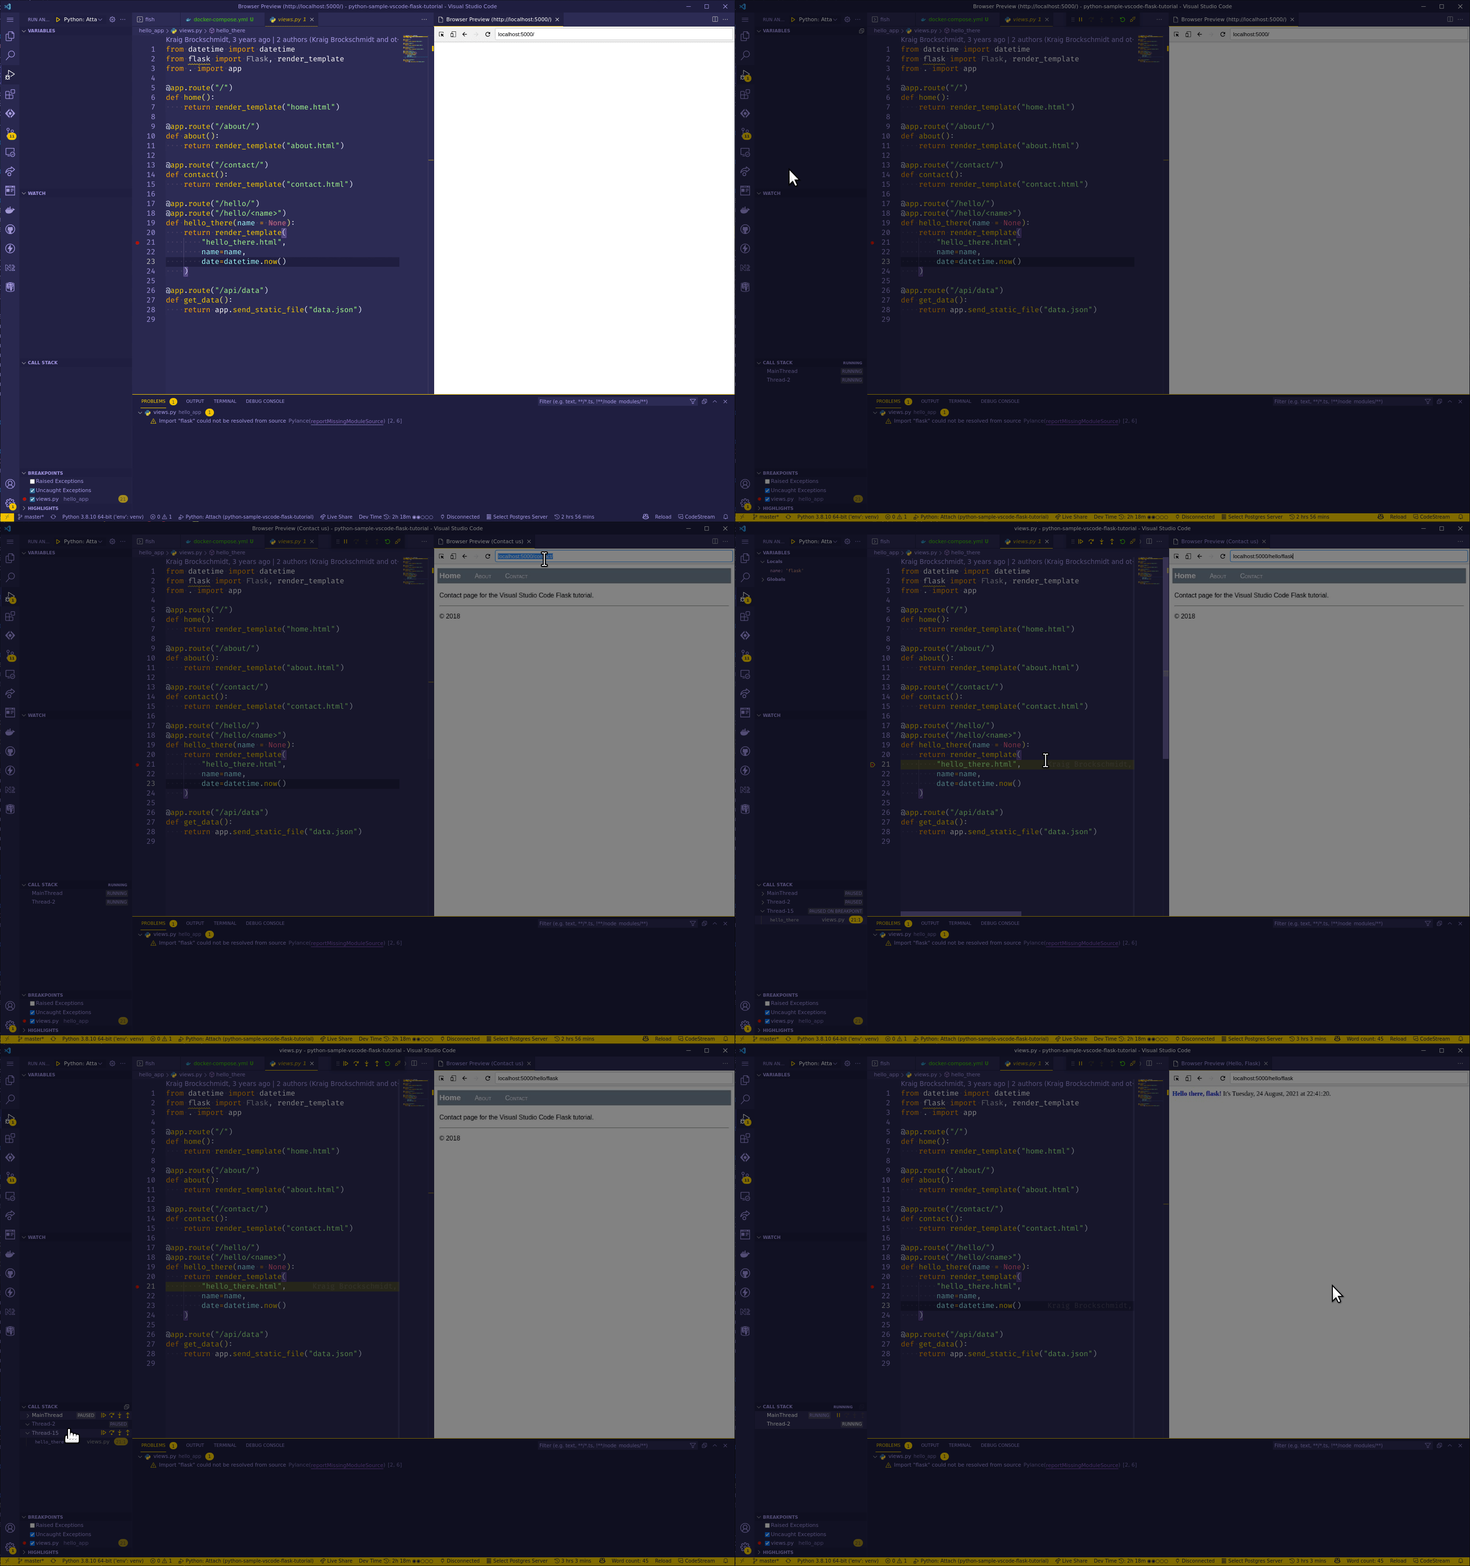
In summary, this is what’s happening:
- In a terminal, run the Docker command with the DEBUG variable set to true.
- When prompted, the debugger can now be attached; run the Python Attach launch configuration.
- Add a breakpoint to the line you want to debug by clicking to the left of its number.
- Call the corresponding route (
localhost:5000/hello/flaskin the GIF). - The debugger stops the code at your breakpoint.
Conclusion
As you’ve probably realized, a powerful Python remote debugging setup can take some effort to incorporate effectively. Trying to replicate the exact conditions that a customer experiences can add another layer of difficulty.
If you want to remotely debug your Python application with much less friction, take a look at Lightrun: our next-gen remote debugger for your production environment. With Lightrun, you can inject logs without changing code or redeploying, and add snapshots: breakpoints that don’t stop your production application. Lightrun supports Python, Java, and Node.js applications, integrates with VS Code, and you can start using it today!