How to use VSCode to debug a Node.js application
May 21, 2022 / Updated: Mar 08, 2026

Debugging is an essential step in software development, as it allows developers to fix errors before releasing the software to the public. Debugging tools can be integrated into code editors, making the debugging process more efficient. This tutorial will show you how to debug Node.js in Visual Studio Code (a.k.a VSCode).
What is Node.js?
Node.js is a JavaScript runtime environment that allows you to run JavaScript code outside a browser. It is not a framework but a technology built on Chrome’s V8 JavaScript engine, allowing it to be used for developing server-side applications and command-line tools. It is also popular on the Internet of Things (IoT). Node.js has a large community of developers who have created a variety of modules that you can use in your own projects.
Node.js apps are applications written in JavaScript that are executed on a server using the Node.js runtime environment. These applications are often built on popular JavaScript frameworks and libraries such as Express and Meteor.
The main features of Node.js are:
- It is an open-source server-side JavaScript runtime environment.
- Node.js is a cross-platform runtime environment that allows you to run JavaScript code on the server-side.
- Applications are written in JavaScript and can be run within the Node.js runtime on OS X, Microsoft Windows, and Linux.
- Applications are single-threaded, meaning that a single process can handle multiple requests simultaneously.
- It is asynchronous, meaning that it can handle multiple requests simultaneously without waiting for each one to finish before starting the next.
- It uses an event-driven, non-blocking I/O model that makes it lightweight and efficient.
- It is available under the MIT license.
While all the above is fantastic, there are bugs where there is code. Debugging becomes a common task for every developer as a side effect.
Step-by-step guide on debugging Node.js in VSCode
Prerequisites
Before we begin this tutorial, we will assume that you have both Node.js and VSCode installed.
For this tutorial, we are going to set up a simple Node.js program with an error in it.
We will then follow a debugging process that will give you the basic scope of how to use the Node.js debugger in VSCode.
To create our simple program, run npm init inside an empty project directory in your console. This will give us a package.json file.
In the same directory, create an app.js file with the following code:
const calculate = (A, B) => {
console.log('Adding...')
let sum = 0
sum = A + B + B + A
return sum
}
const num1 = 1
const num2 = 1
const result = calculate(num1, num2)
console.log(num1 + ' plus ' + num2 + ' = ' + result)We know this is incorrect. There is a deliberate bug introduced in the sum variable. If we run the program with the command node app.js, we’d get the following output:
 Adding...
 1 plus 1 = 4.
Using the Node.js debugger in VSCode
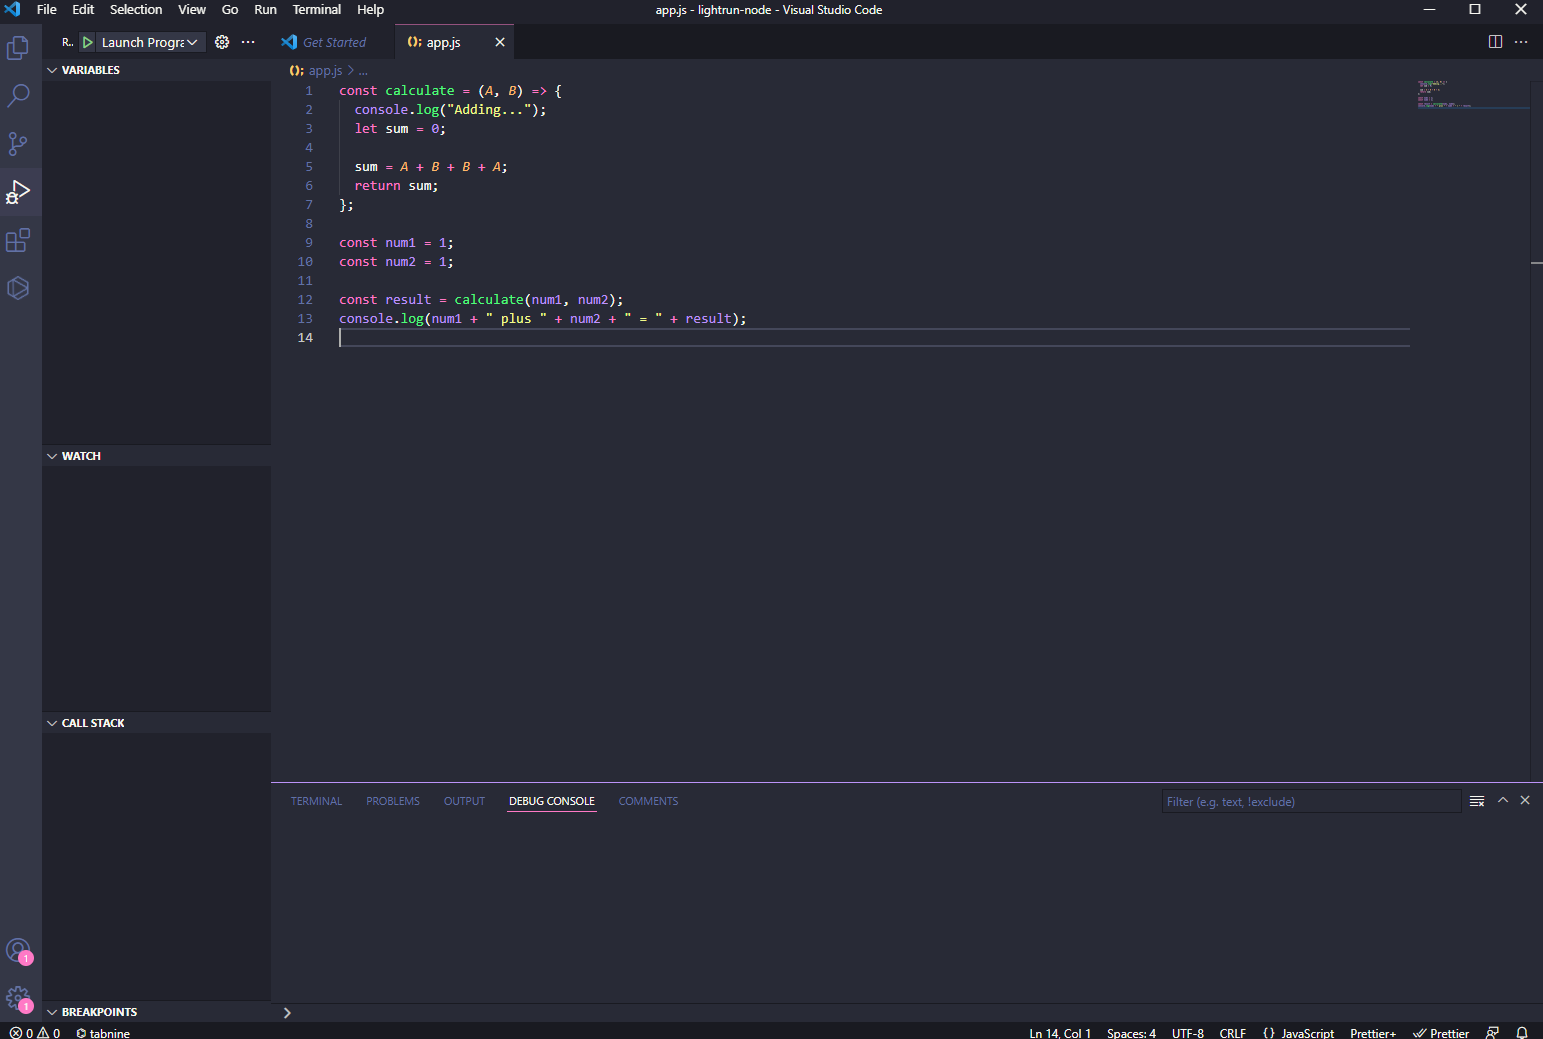
VSCode comes with a built-in debugging tool that developers can use to debug Node.js applications. This tool is located on the left-hand side panel and looks like this:
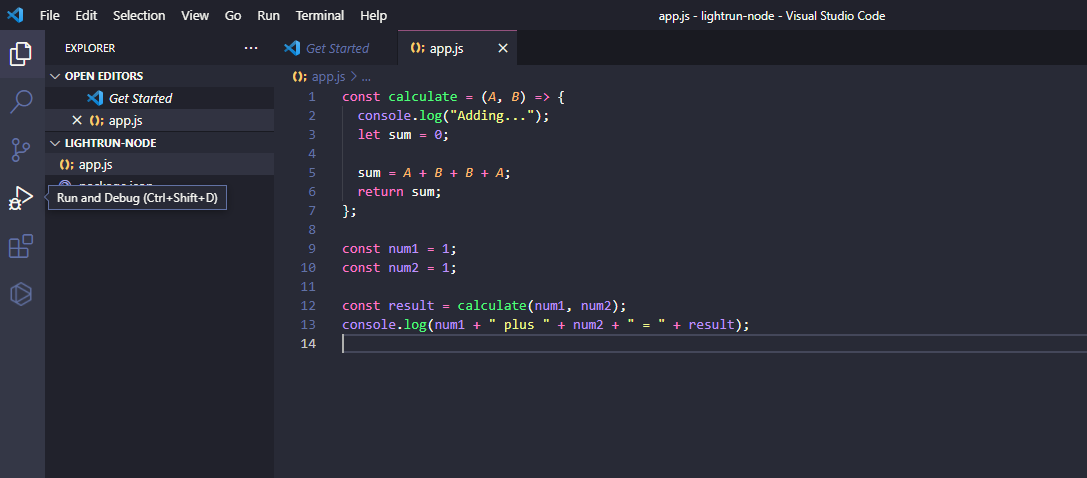
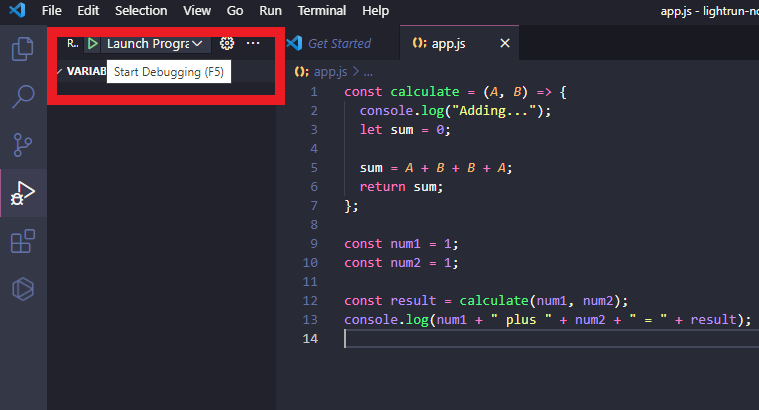
Alternatively, you can also use the keyword shortcut Ctrl + Shift + D to switch to VSCode’s debugging panel.
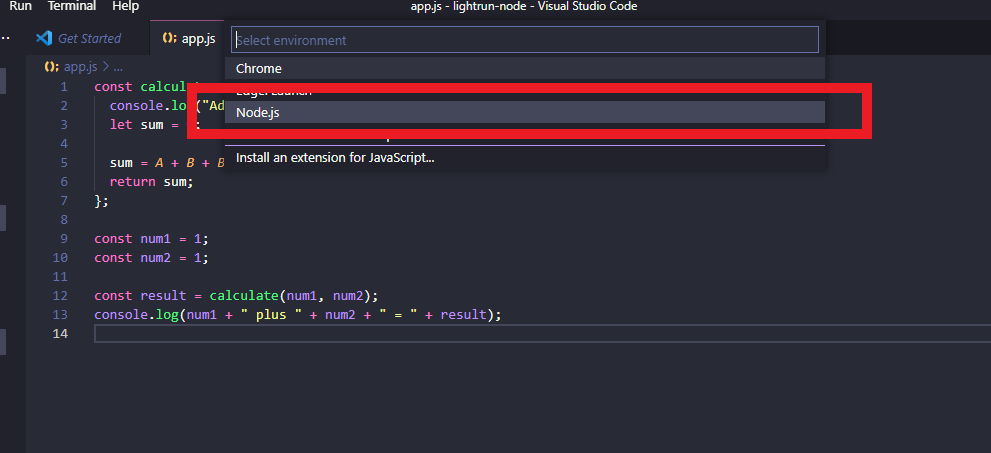
Next, click create and launch.json file and select Node.js.
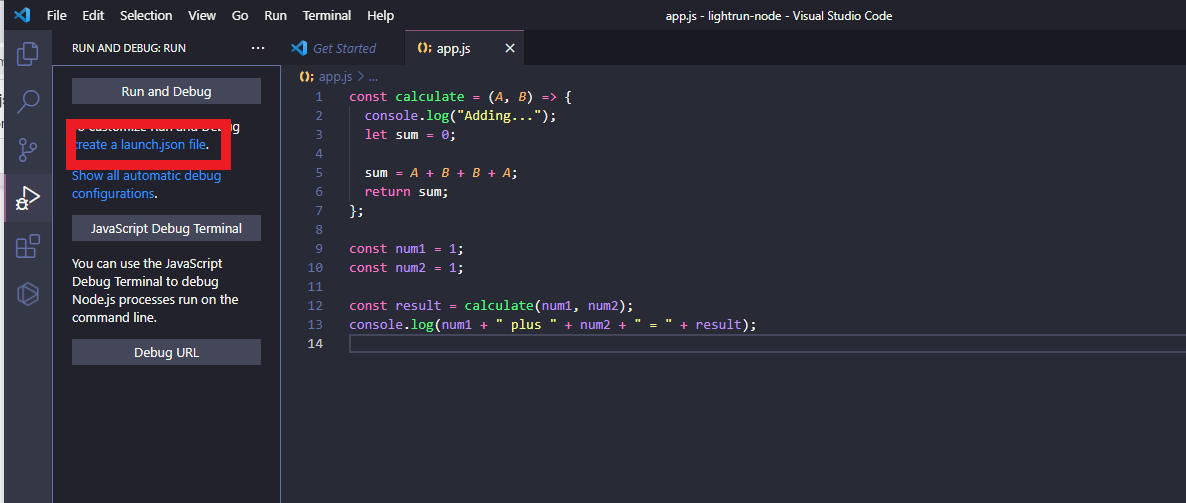
You will see a configuration that looks something like this:
{
    // Use IntelliSense to learn about possible attributes.
    // Hover to view descriptions of existing attributes.
    // For more information, visit: https://go.microsoft.com/fwlink/?linkid=830387
    "version": "0.2.0",
    "configurations": [
        {
            "type": "pwa-node",
            "request": "launch",
            "name": "Launch Program",
            "skipFiles": [
                "<node_internals>/**"
            ],
            "program": "${workspaceFolder}\src\app.js"
        }
    ]
 }
Sometimes, depending on your file directory setup or version, the assigned value to the program may not match the entry main file to your application. For that particular situation, you just need to change it to whatever your main entry file is – which is typically something like app.js or index.js.
You can also configure the Node.js debugger to skip certain files listed under the skipFile array.
Once you’ve completed this, you can save and exit the file. This will change the way the VSCode debugging side panel looks. Here is the updated screenshot.
When you click the play button next to Run, it will launch and run the program through the Node.js debugger. The debugger console will run and exit with the standard output of Process exited with code 0, which means everything worked as expected.
The process of debugging a Node.js app
To debug your app.js file in VSCode, you can set breakpoints by clicking on the red dot when you hover over the line number you wish to put it. A breakpoint is a place where the VSCode debugger intentionally stops or pauses the program’s execution so that you can inspect state changes in the variables and watch and call stack panels located on the left-hand side of the UI.
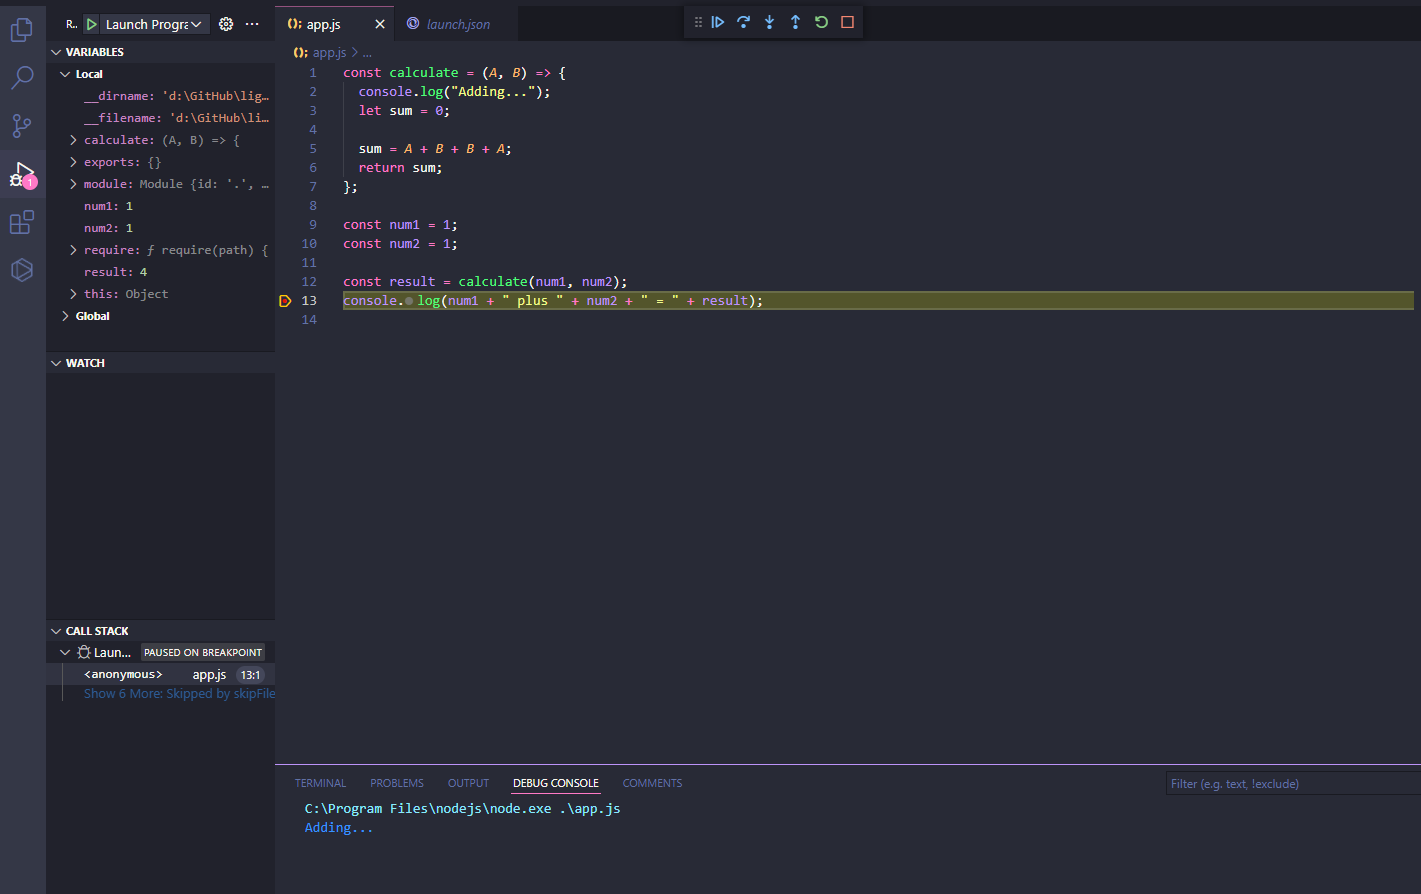
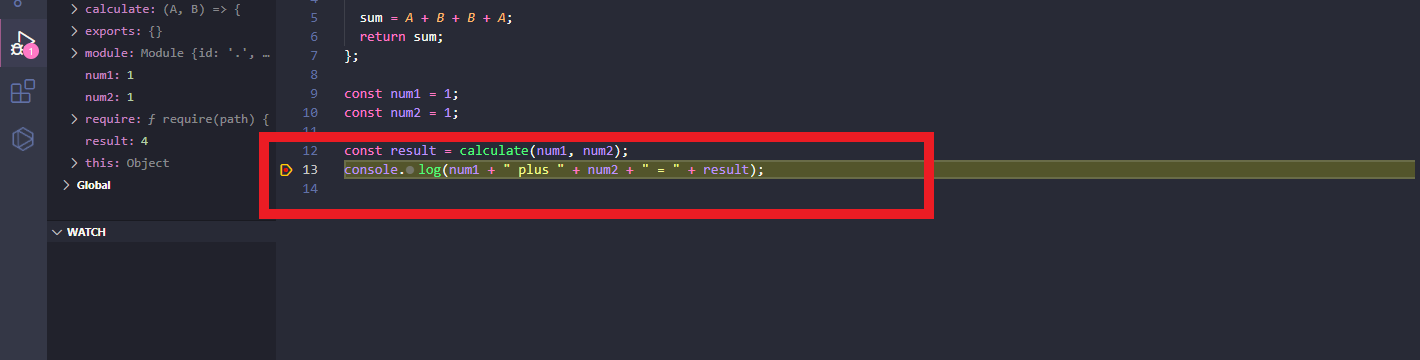
Now, when you rerun the program, it will continue down the code and stop at where you placed the red dot. Looking over the variables panel will log out the current state of the values assigned. Simply right-click on the red dot and select Remove breakpoint to get rid of a breakpoint that you no longer need.
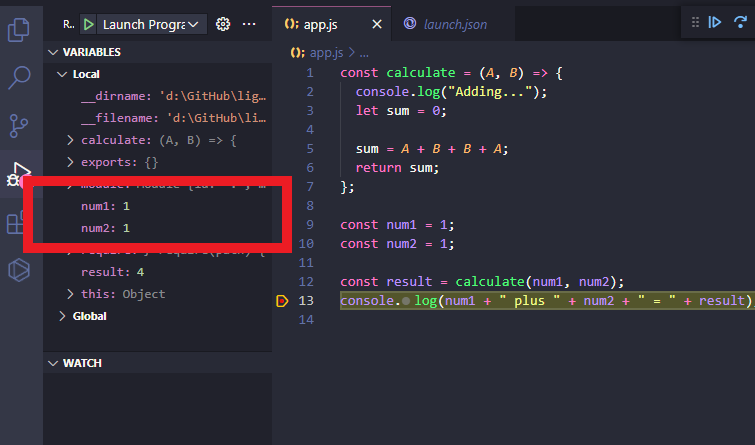
Here, our A and B variables are set with values, but the result variable is undefined because it is yet to be defined in the program – meaning that it doesn’t exist yet.
The VARIABLE panel outputs all the current variables and their states.
Meanwhile, the WATCH panel lets you cherry-pick specific variables that you want to keep an eye on. This panel is helpful because it gives you instant insight into what is happening with the code.
If you look to the top of the UI, you will also encounter a control panel that looks something like this:
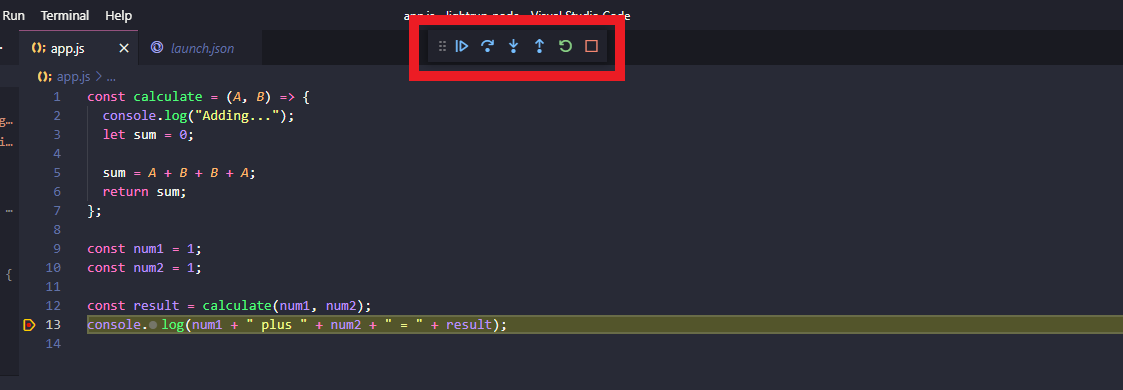
This panel controls the VSCode debugger’s progression through the program. Each control does the following:
- Continue (F5) will run past the breakpoint and continue with the rest of the program until it hits the next breakpoint.
- Step over (F10) will take the debugger down to the next line.
- Step into (F11) will take the debugger into the next function.
- Step out (F12) will take the debugger out from the function and into the next step.
- Restart (Ctrl+shift+F5) will relaunch the VSCode debugger.
- Stop (shift+F5) will stop debugging and exit the process being debugged.
When you click on one of the above controls, you are essentially slowing down the program so you can see the updates occur in the console, the variables, watch, and call stack panels.
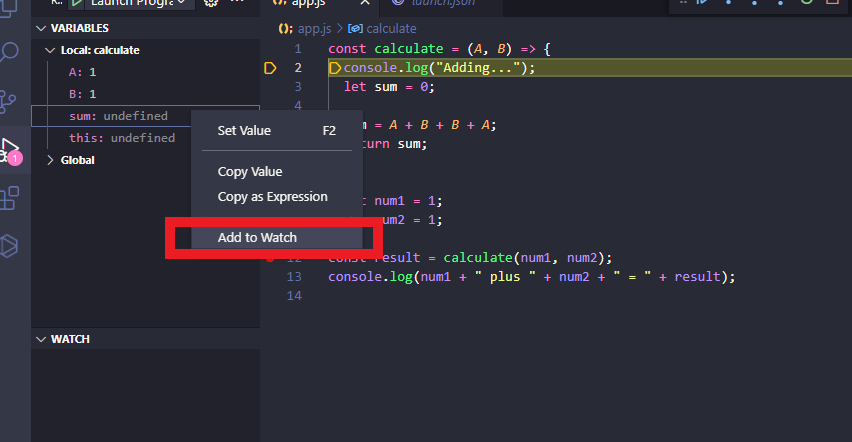
Going back to our code sample, it will take us to the calculate() function if we click Step Into. If we look at the VARIABLE panel, we see that the values in it have changed to reflect the local variables currently in scope. When you right-click on a variable, you can select it as a target to watch. Setting this will add the variable to the WATCH panel as per below.
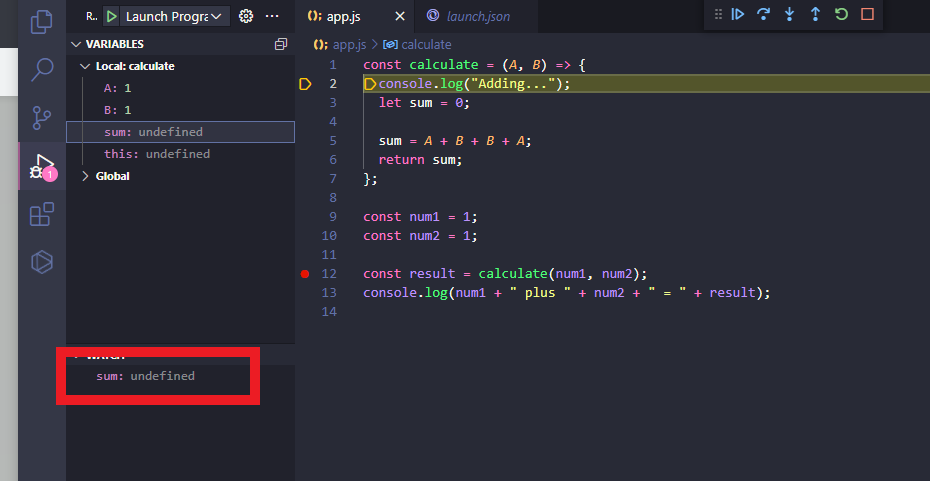
If you click Step Over, it will run the following line. Our console will simply say Adding… because it’s executed the console.log() call. However, the watched variable has now changed from undefined to 0.
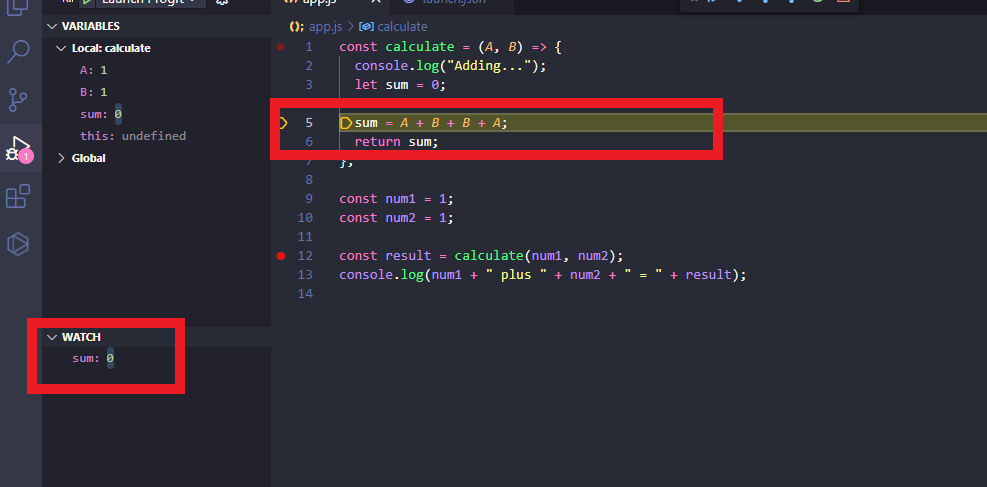
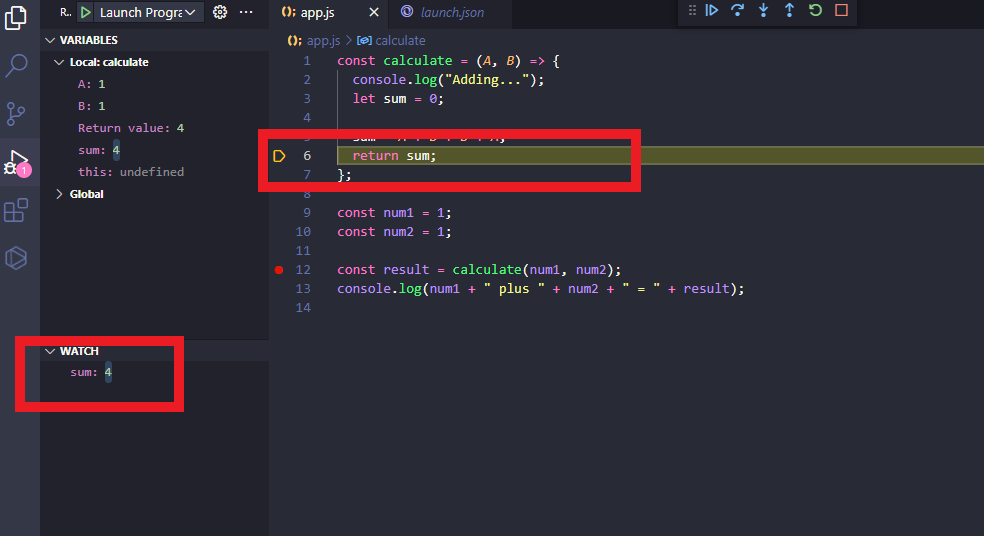
If we run the following line, we will see that the sum variable inside watch has changed to an incorrect value. You can deduce that something wrong occurred in the previous line. We can now fix the issue, rerun the entire VSCode debugger, and ensure everything is working.
Debugging Node.js in production with Lightrun
While debugging Node.js code during development is easy enough in VSCode, it’s a different kind of ball game when debugging in production. When there’s a bug in production, we cannot simply shut down the server and take the code down to debug. Not only that, replicating production bugs in a development environment may not be possible. This is where a tool like Lightrun can help.
Lightrun is our next-gen remote debugger for your production environment. With Lightrun, you can inject logs without changing code or redeploying, and add snapshots: breakpoints that don’t stop your production applications. Lightrun supports debugging Node.js, Java, and Python production applications, integrates with VSCode, and you can start using it for free.