Tutorials

Maximizing Developer Efficiency and Secure User Management: The Power of Lightrun Agent Pools
Introduction In the dynamic landscape of modern application development, managing telemetry across diverse environments and technologies can be…
Maximizing Developer Efficiency and Secure User Management: The Power of Lightrun Agent Pools
Introduction In the dynamic landscape of modern application development, managing telemetry across diverse environments and technologies can be…
Securing Your Applications: A Guide to Log Injection Prevention
Introduction Log injection is a well-known vulnerability that can pose serious threats to the security of your applications.…

Troubleshooting Cloud Native Applications at Runtime
Co-Authored with Gilles Ramone (Chronosphere) Chronosphere and Lightrun demonstrate how their combined solutions empower developers with optimized end-to-end…
Debugging Race Conditions in Production
Race conditions can occur when a multithreaded application accesses a shared resource using over one thread. Unless we…
popular
Understand Source Code – Deep into the Codebase, Locally and in Production
Learn a new codebase by diving into it with debuggers to understand the full extent of internal semantics & interactions within the project.
Top 8 VS Code Python Extensions
Visual Studio Code (a.k.a. VS Code or VScode) is an open-source and cross-platform source code editor. It was…
Top 8 IntelliJ Debug Shortcuts
Let's get real - as developers, we spend a significant amount of time staring at a screen and…
Spring Transaction Debugging in Production with Lightrun
Spring makes building a reliable application much easier thanks to its declarative transaction management. It also supports programmatic…
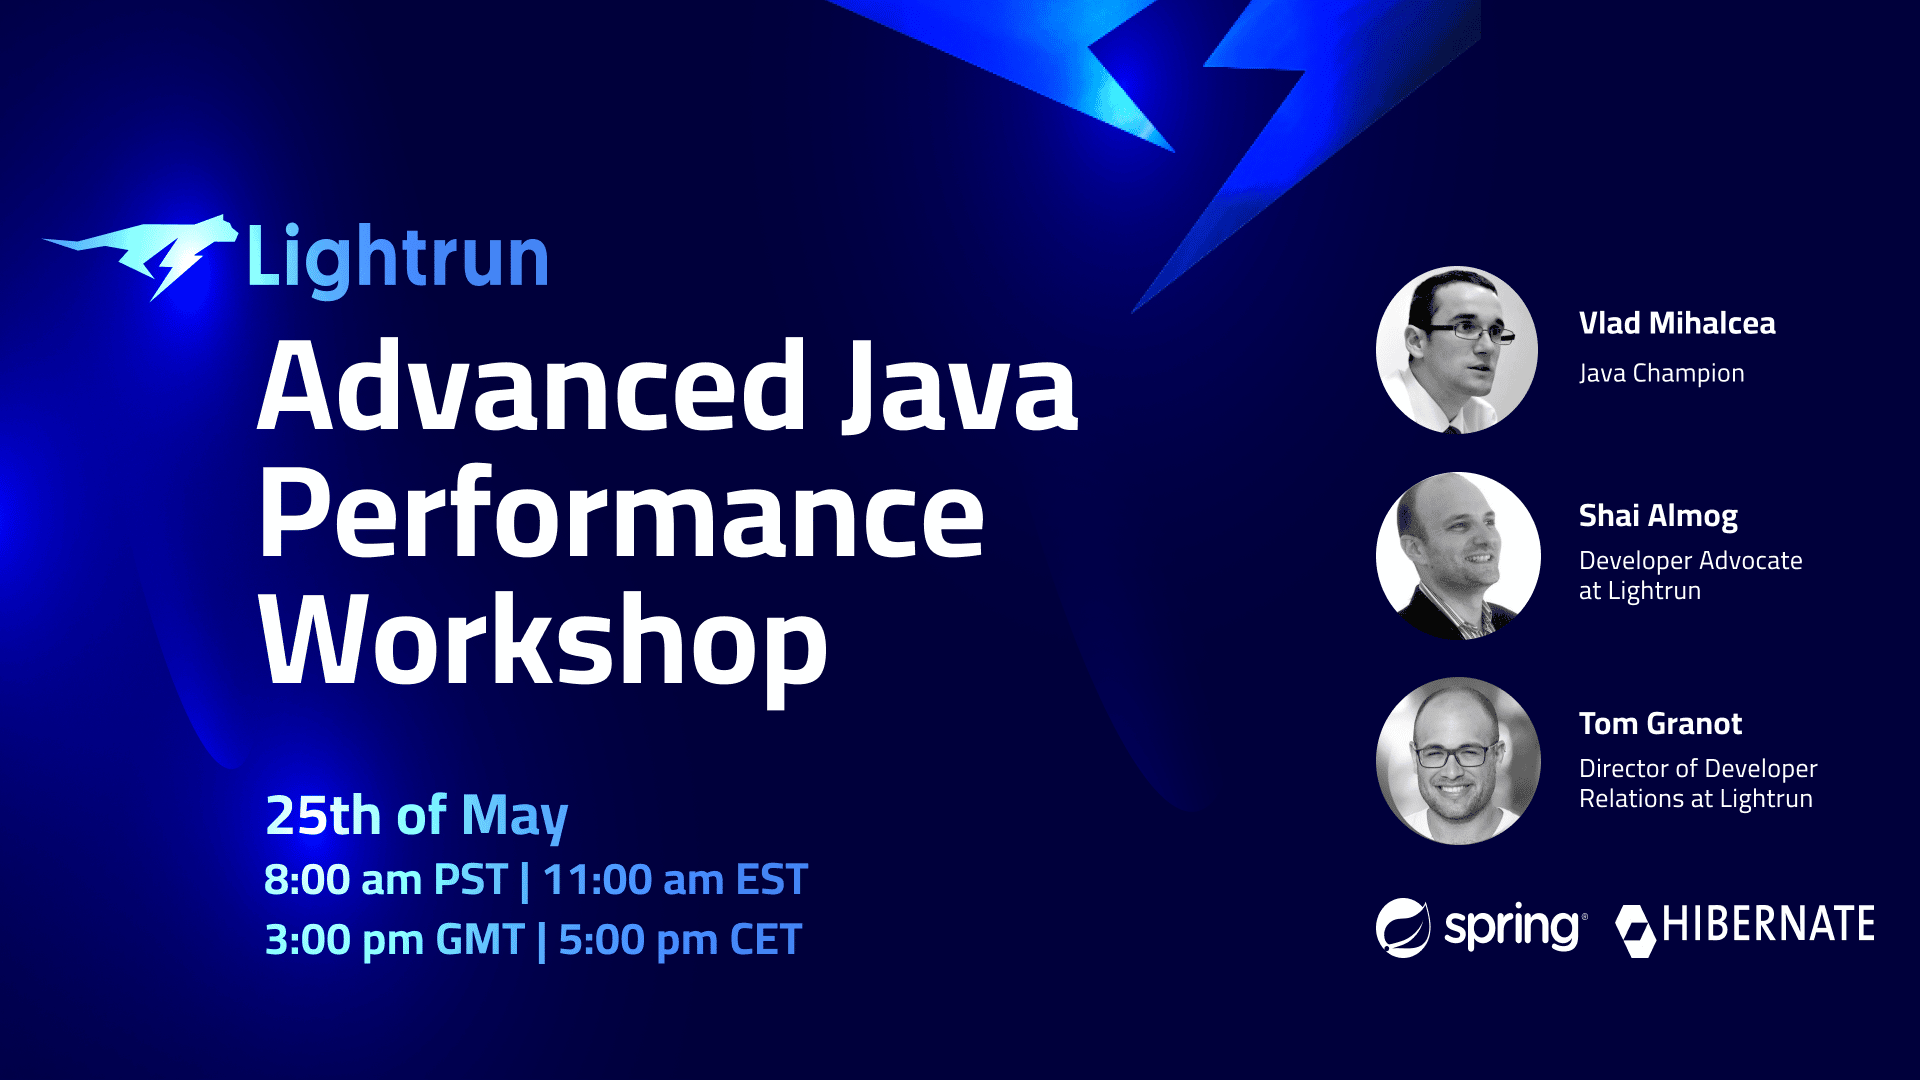
Spring Boot Performance Workshop with Vlad Mihalcea
A couple of weeks ago, we had a great time hosting the workshop you can see below with…
OpenTracing vs. OpenTelemetry
Monitoring and observability have increased with software applications moving from monolithic to distributed microservice architectures. While observability and application monitoring share similar definitions, they also have some differences