Maximizing Developer Efficiency and Secure User Management: The Power of Lightrun Agent Pools
Introduction
In the dynamic landscape of modern application development, managing telemetry across diverse environments and technologies can be a daunting task. Adding to that challenge is the multiple groups that are involved in the software development life cycle within an organization. Having the ability to troubleshoot a specific environment or application while ensuring that the right teams and individuals have the proper permissions and access to this environment is a core pillar in debugging remote and distributed workloads.
GuardRailing and Enabling Distributed Teams Debugging
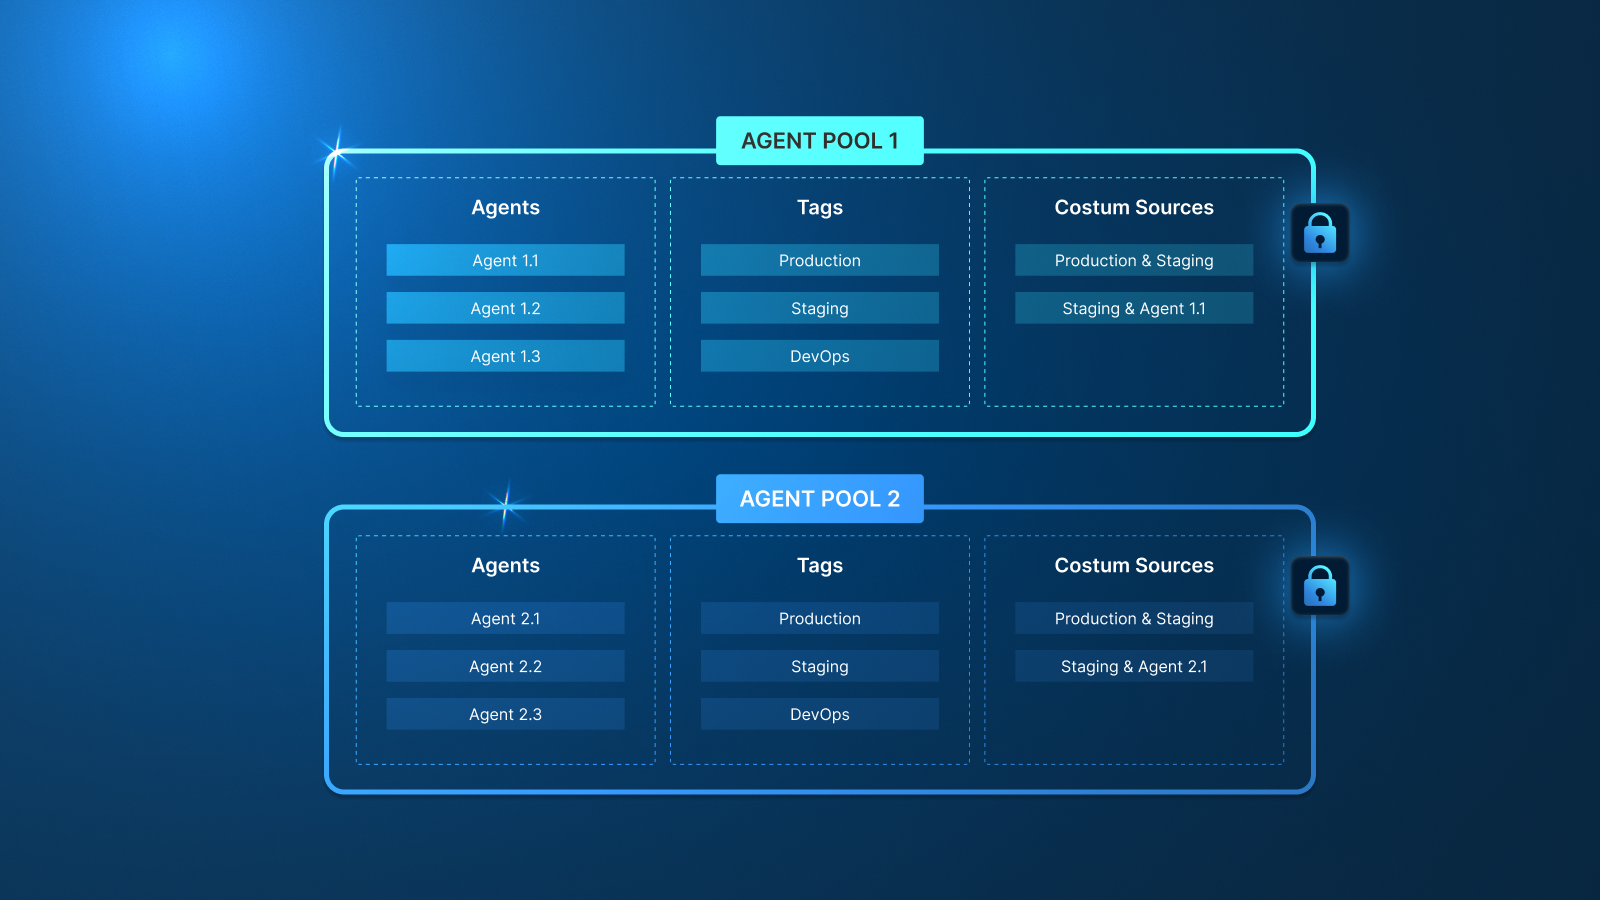
As mentioned above, granting developers access to the right environment whether it is production, staging, CI/CD or QA is an imperative to a streamlined debugging process as well as an efficient and fast one. When employing Lightrun Agent Pools for live debugging it becomes a game-changer in the sense of simplifying and streamlining telemetry management for developers, enhancing productivity, and reduction of mean time to resolution (mttr) of complex issues. What exactly are Agent Pools? Think of them as your command center for orchestrating telemetry across different groups of deployed applications. Whether your applications are powered by Java, Node.js, .NET, Python, or a mix of these technologies, Lightrun Agent Pools have you covered. By organizing applications based on their technologies, environments, and cloud providers, Agent Pools ensure that developers have access only to the telemetry relevant to their projects.
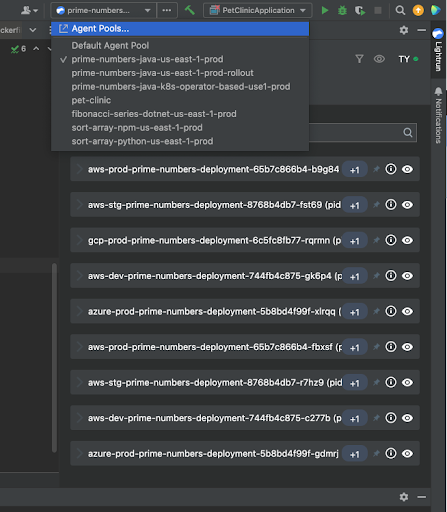
Example: Lightrun IntelliJ plugin is showing a menu of all available agent pool for some developer; once selecting the agent pool all it’s agents are available for troubleshooting
Imagine a scenario where you’re troubleshooting an issue in a complex microservices architecture spanning multiple technologies and environments. With Lightrun Agent Pools, you can effortlessly navigate through the maze of applications, selecting the appropriate pool tailored to your specific project. No more sifting through irrelevant telemetry or grappling with cumbersome setups. Placing a Lightrun action (Snapshot, dynamic log, metrics) can be done easily against the relevant environment and agent pool while adhering to the users permissions and roles within the engineering group.
Once you’ve zeroed in on the right Agent Pool, the power of Lightrun truly shines. With just a few clicks, you can seamlessly add Lightrun logs and dynamically instrument the relevant telemetry, all without disrupting your workflow. This means faster debugging, proactive monitoring, and enhanced visibility into your applications’ performance – all at your fingertips.

But the benefits don’t stop there. With Lightrun Agent Pools, you’re not just gaining streamlined telemetry management; you’re also future-proofing your development process. As your applications evolve and new technologies emerge, Agent Pools adapt to accommodate these changes, ensuring that your telemetry infrastructure remains agile and scalable.
Agent Pool Administration
Creation and management of the Agent Pools with the relevant groups who should access them is made easy using the Lightrun Management Portal, with Admin permissions you can create agent pools, assign relevant groups to the right agent pools they should access:
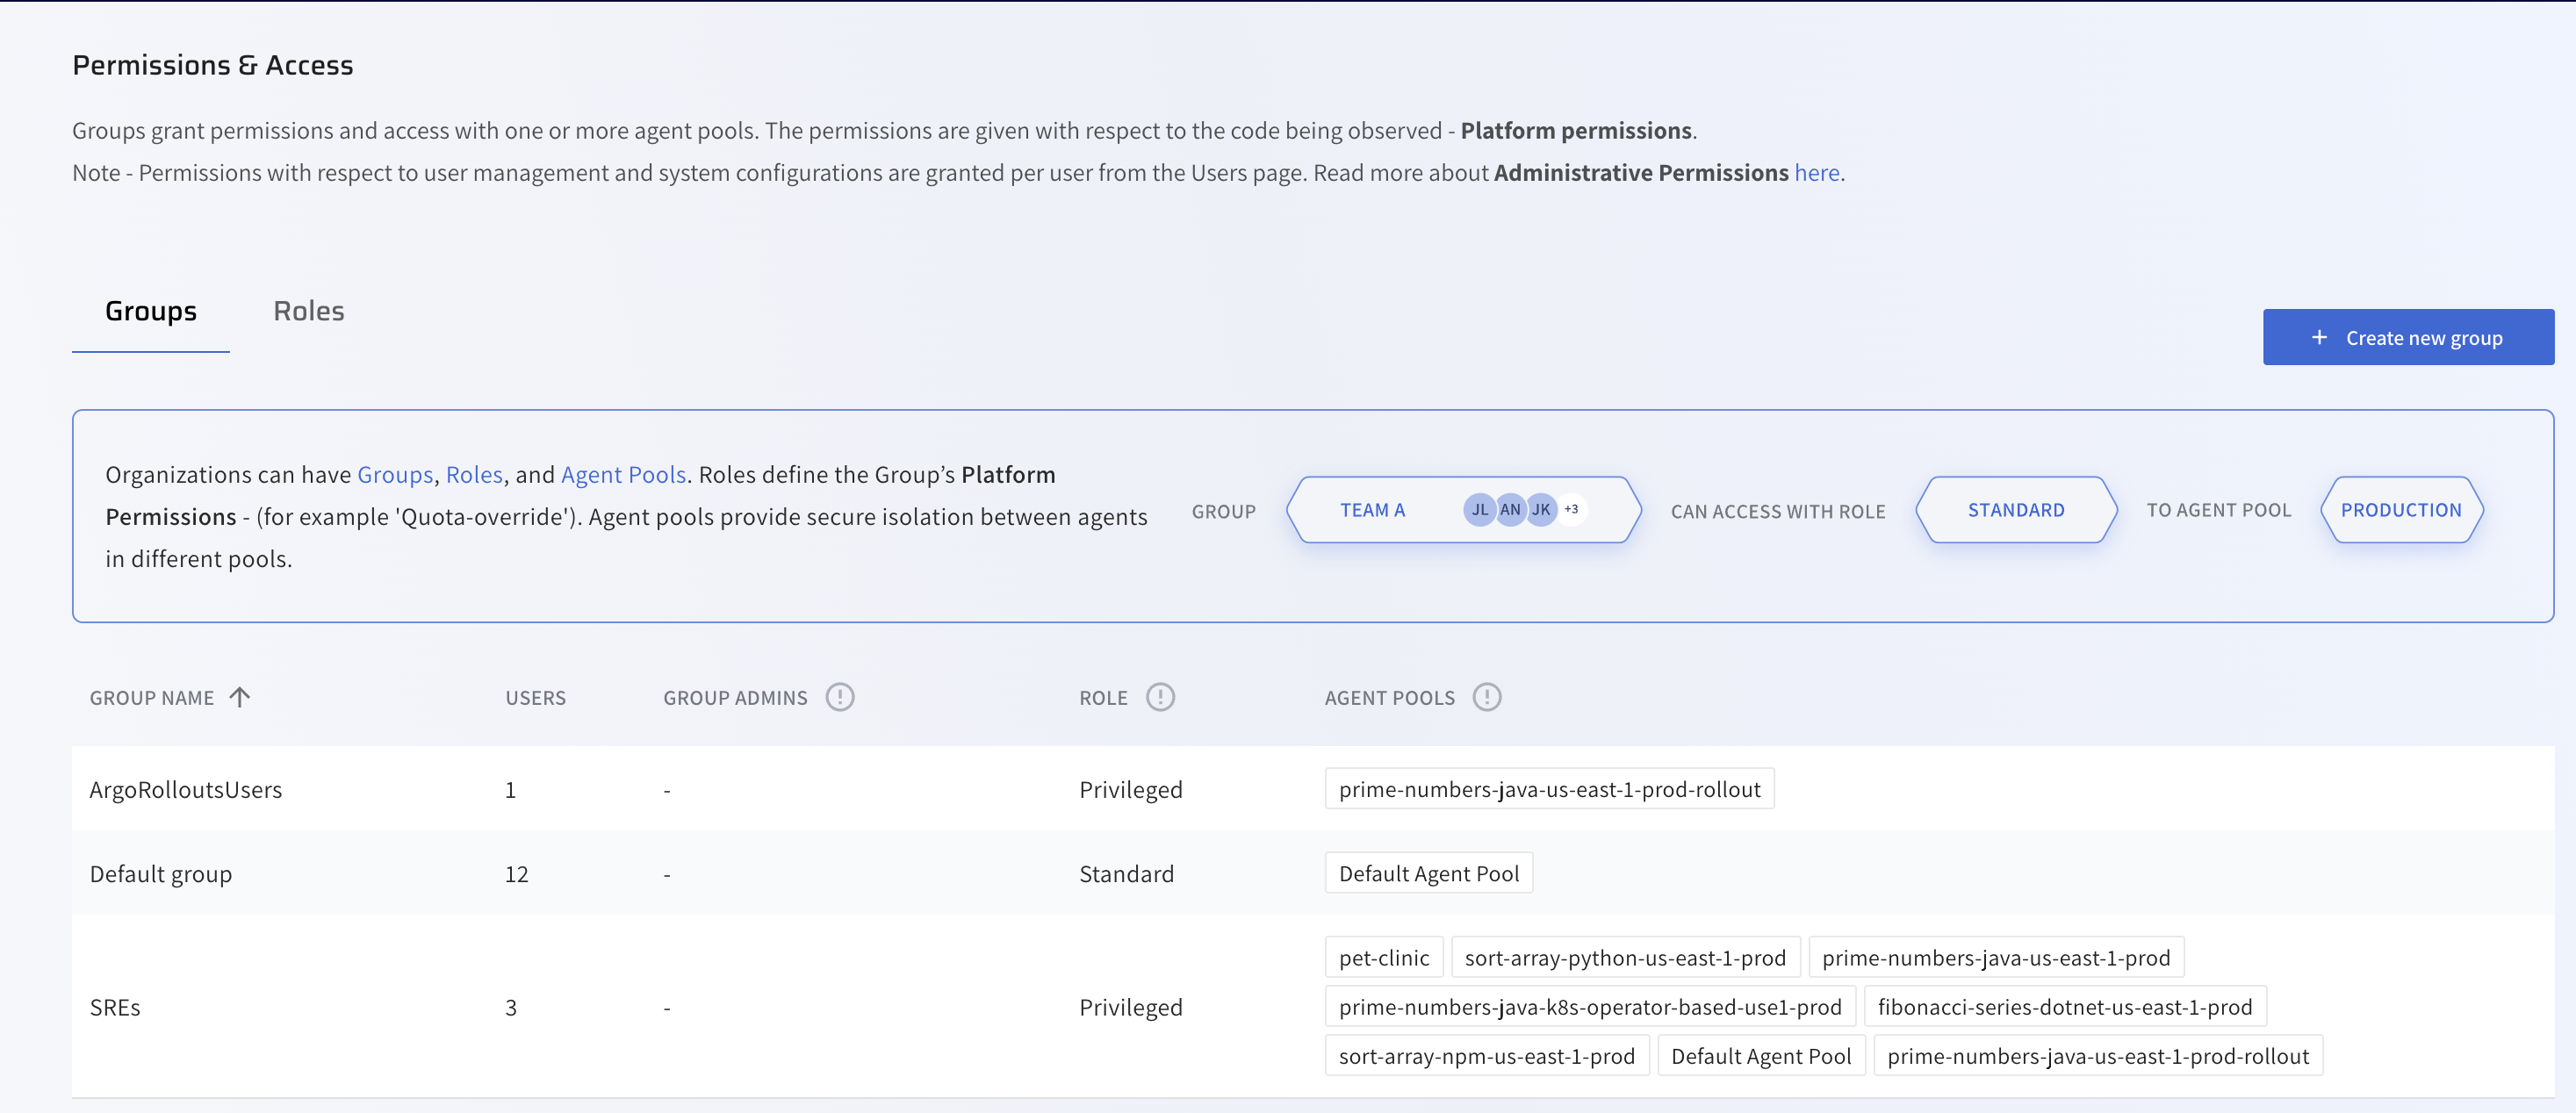
Example: SREs group have access to all agent pools while ArgoRolloutsUsers group has only access to one agent pool.
Lets see the use of Lightrun agent pools in action in this short demonstration:
In the above demo we were able to show how easy it is for a developer to navigate between multiple organizational agen pools and use the one that he has access to for live debugging. Once developers select the agent pool for the environment that they need to debug, they can easily instrument live and conditional logs, snapshots (virtual breakpoint), and metrics without the need to stop the application at runtime or to re-run a complete CI/CD cycle.
Bottom Line
With the growing complexity of applications and the scale that they run at, providing developers with a relevant runtime debugging directly from the IDE in a managed environment makes the entire process more controlled, governed, and efficient. Solving production or pre-production incidents are much more effective with environments more accessible on-demand to the relevant developers.

It’s Really not that Complicated.
You can actually understand what’s going on inside your live applications.