Lightrun Empowers Developers with Next Generation Metric Tools for Java Performance Troubleshooting
Jul 30, 2023

Introduction
When it comes to debugging performance related issues, the range of these issues together with their root cause can be overwhelming to developers.
Resolving performance issues is a challenging task due to the multitude of potential factors that can contribute to their occurrence. These factors range from inefficient code or architecture that lacks scalability, to specific infrastructure problems related to hardware and storage. Additionally, reproducing performance issues in a local environment that mimics the production setup can be difficult, as well as identifying and addressing these issues for specific sets of users. Developers often encounter these common challenges when attempting to resolve performance problems. Furthermore, developers may also face a lack of expertise in utilizing Application Performance Monitoring (APM) tools, which, in any case, may not offer code-level insights and actionable information.
For developers who want to address code-specific inquiries when troubleshooting performance issues, such as:
- Determining how many times a particular line of code is executed
- Whether a specific line of code is reached
- The execution time of a method
- The execution time of a code block
Pinpointing the exact lines of code responsible for downtime or performance problems can be a challenging and intimidating task. Moreover, identifying performance anomalies within a specific area of the product becomes exceedingly difficult without access to comprehensive insights and meaningful correlations between metrics obtained from various sources, such as the database, CPU usage, network latency, and so on.
Marketplace Gap
While the APM and profiling marketplace today is extremely advanced and offers a range of tools and solutions for monitoring and alerting the developers and Ops when a degraded service occurs, these tools are not operating within the source code or the IDE itself, and requires the developers to be very well versed in these tools and domain instead of him focusing on the code areas that are causing these issues. Having the ability to combine APM tools and dashboards with a developer native observability solution is a perfect bridge to the existing gap and the above-mentioned challenges. That was the rationale behind launching the advanced Lightrun Metrics for performance observability and debugging.
Solution Overview
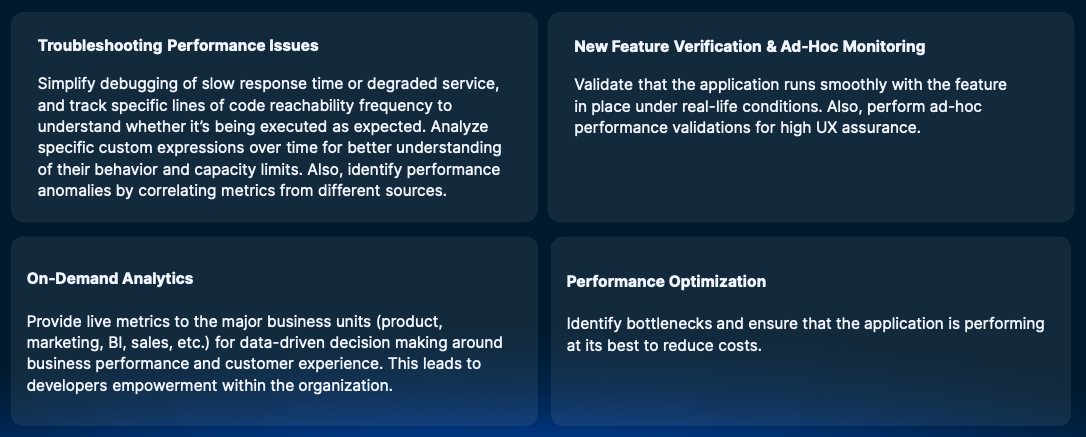
When trying to address the above mentioned gaps as well as challenges, Lightrun Metrics comes to focus on the following 4 use cases and shift left performance observability:
It does so by providing developers with 4 key metrics that are being collected and consumed within the Java IntelliJ IDE as well as piped to leading APM tools dashboards.
4-type Metrics Collection
The Lightrun Metrics dedicated tab within the IDE plugin consists of the following:
Counters* (coming Soon), TicToc, Method Duration, and Custom Metrics. Below are some details on what each of these provide.
- Counters
A Lightrun Counter is added to a single line of code. It counts the number of times the code line is reached. You can add a counter to any and as many lines of code you need. From the Lightrun IDE plugin, you can specify the conditions (as Boolean expressions) when to record the line execution
- TicToc (Block Duration)
The Lightrun Tic & Toc metric measures the elapsed time for executing a specified block of code, within the same function
- Method Duration
The Method Duration metric measures the elapsed time for executing a given method
- Custom Metric
Lightrun metrics enables developers to design their own custom metric, using conditional expressions that evaluate to a numeric result of type long. Custom metrics are all about value distribution and correctness within a given Java application, and it allows developers to transform a specific variable value into statistics and detect anomalies or other distribution trends. Custom metrics can be created using the configuration form in the Lightrun IDE plugin.
Example/How To Use
To get started with Lightrun Metrics, developers would need to create a new Lightrun account and install the IntelliJ dedicated plugin. Once the setup is complete developers can start creating metrics across the 4 types highlighted above. Here are examples of the creation and understanding of them.
Note that you can use the Lightrun actions against a single application instance or a few based on the amount of agents attached to these instances and collect metrics and averages.
TicToc
To add a TicToc and measure a block of code execution duration, go to the Lightrun plugin within the IntelliJ IDE and right click the line of code to add the specific action.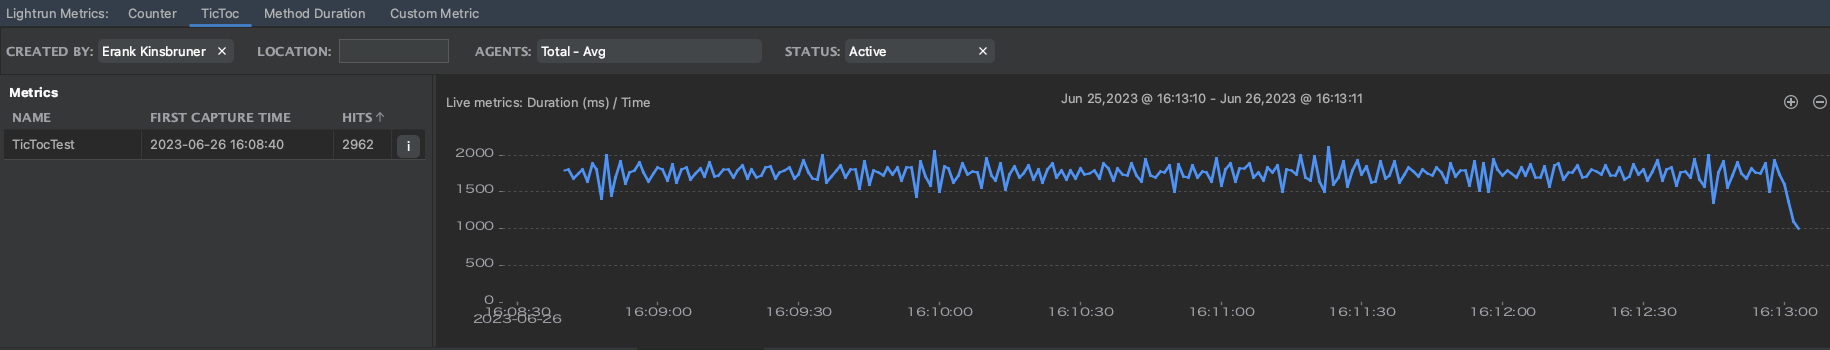
As you can see in the above screenshot, developers can gain runtime code-level execution performance within the TicToc graph and examine averages across deployments and over time.
Custom Metric
To build a custom expression around the code under investigation, go to the Lightrun plugin within the IntelliJ IDE and right click the line of code to add this specific action.
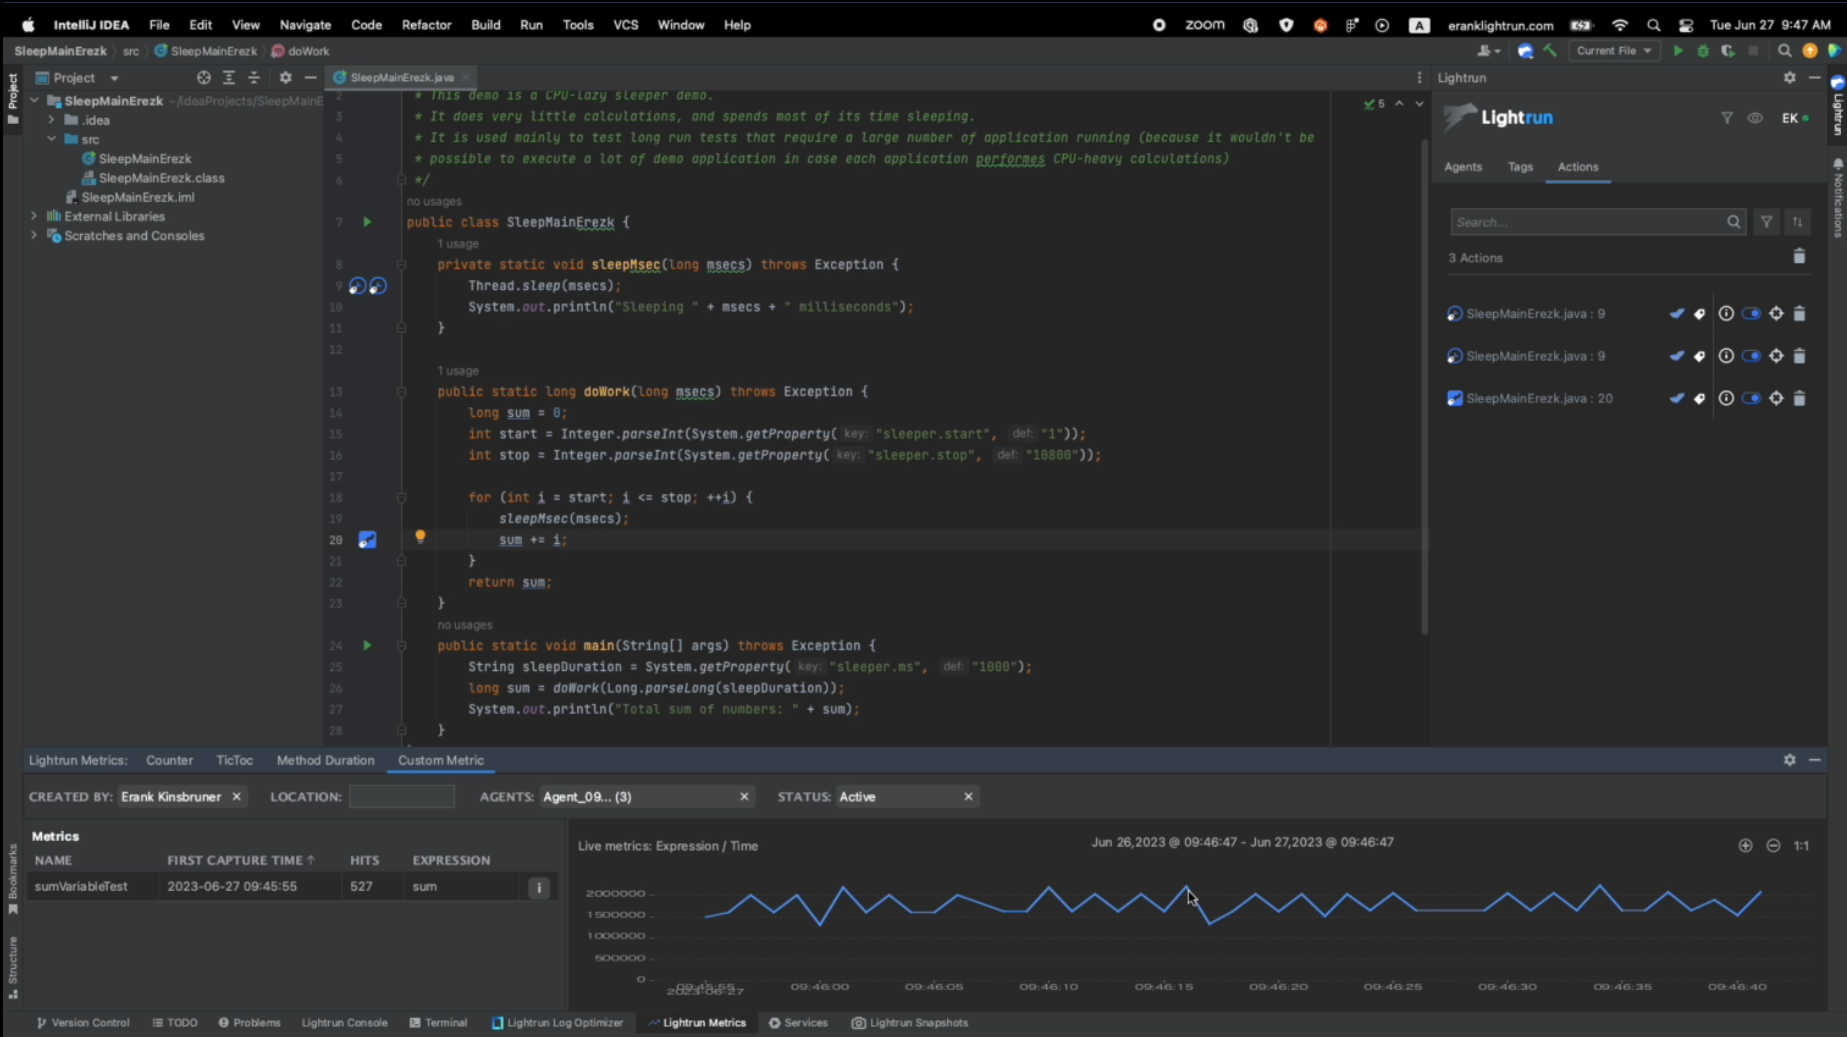
Visualizing the action output within 3rd party tools can be done through our various integrations and by setting the target output within the IDE plugin user interface.
Below is a complete demo video that shows the entire solution and the different metric options used in a Java application that’s running with 20 agents attached.
Bottom Line
Shifting left developer observability and employing the observability driven development workflow can be much easier through such tools and capabilities. When developers are better equipped with tools that fit their skillset and that operate from within their native environments, they are much more productive, hence, can resolve the issues at hand much faster. They can specifically analyze performance issues from the code level and reduce the overall MTTR for such issues, and they can do so by not having to change the application state since these actions are all added and consumed in runtime.
Get Started with Lightrun Metrics!