Lightrun Launches New .NET Production Troubleshooting Solution: Revolutionizing Runtime Debugging
Apr 24, 2023

Introduction and Background
Lightrun, the leading Developer Observability Platform for production environments, announced today that it has extended its support to include C# on its plugins for JetBrains Rider, VSCode, and VSCode.dev. With this new runtime support, .NET developers can troubleshoot their apps against .NET Framework 4.6.1+, .NET Core 2.0+, and .NET 5.0+ technologies.
This new runtime support enables developers to seamlessly integrate Lightrun’s dynamic instrumentation and live debugging capabilities into their .NET applications running on these popular development platforms without requiring any code changes or redeployments.
It’s important to understand that Microsoft’s .NET technology underwent a significant evolution over the past years from being a closed development technology up until .NET 5.0 release in 2021, when it became open-source and publicly available on other operating systems like Linux.
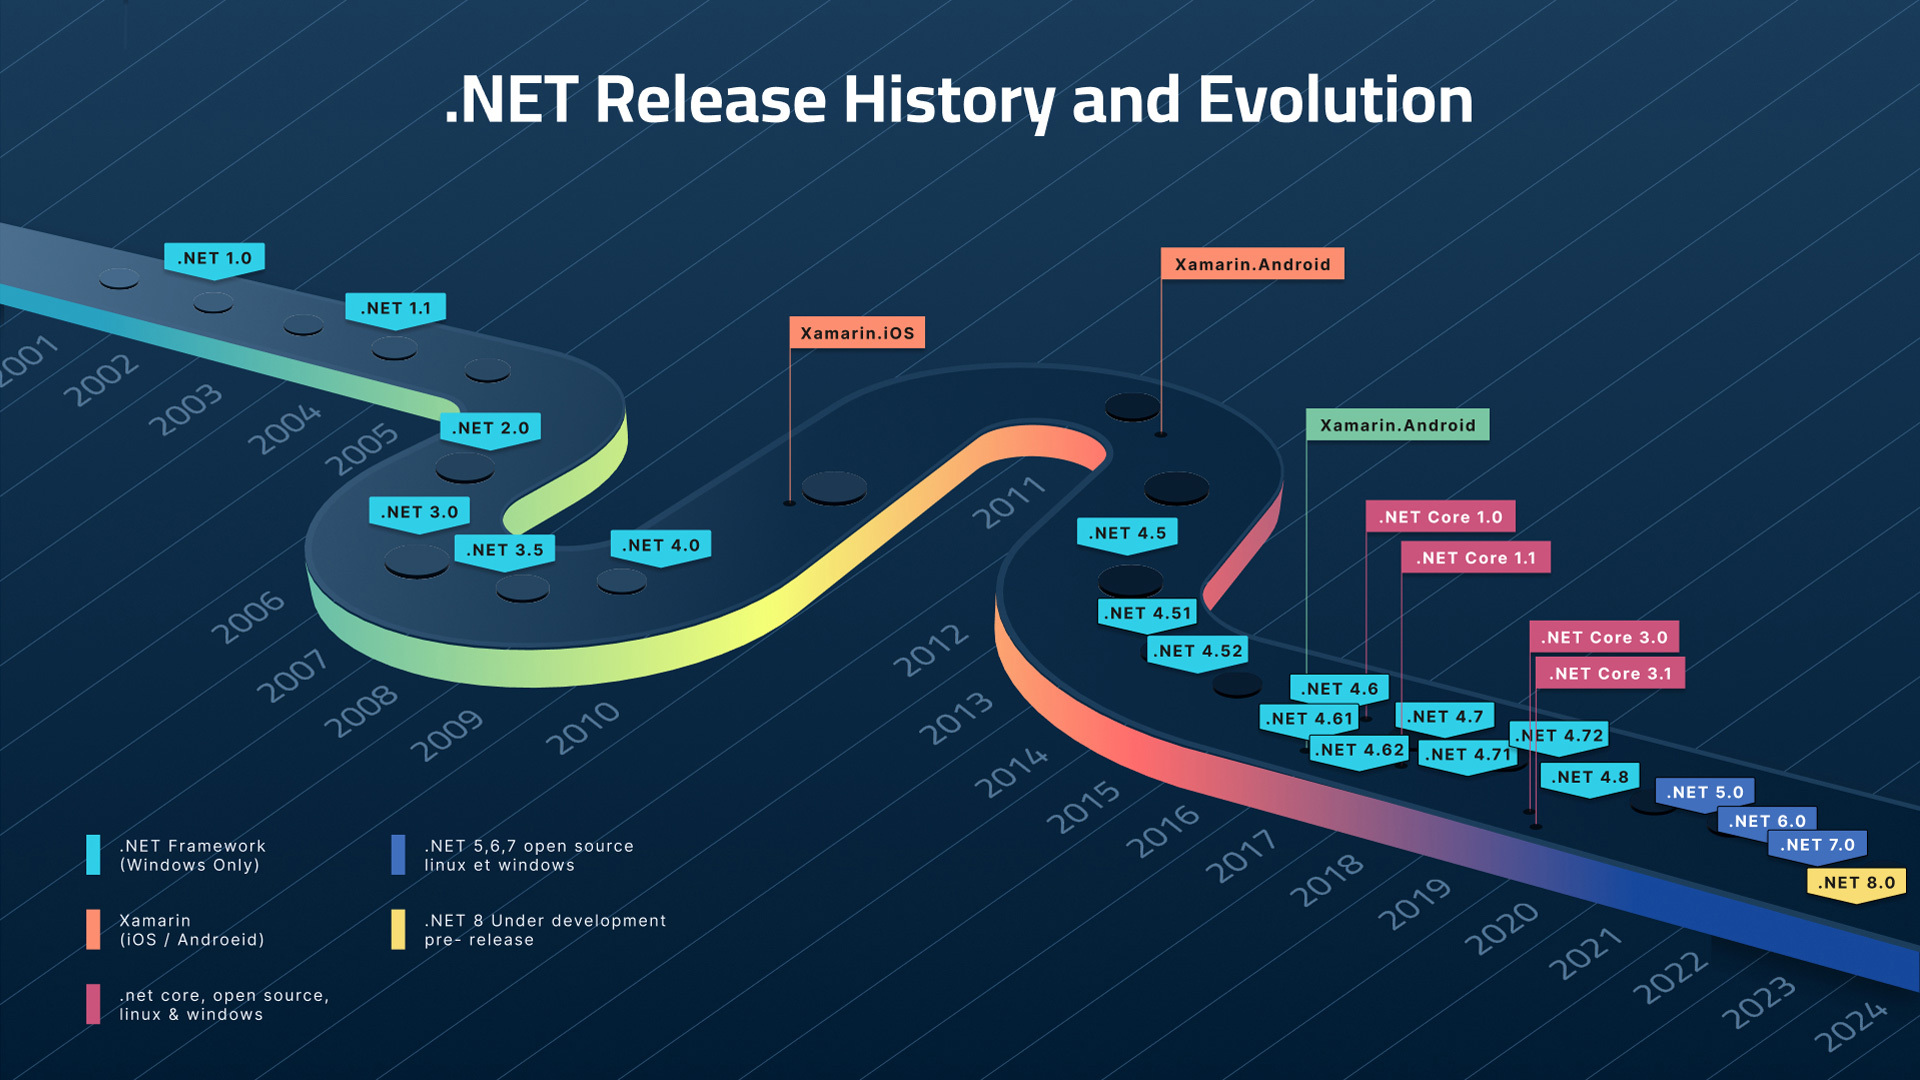
With the above transformation and growing adoption of .NET, development teams are faced with the ongoing task of delivering code at an increasingly rapid pace without sacrificing the critical components of quality and security. This challenge is exacerbated by the intricate and elaborate nature of distributed architecture. While this architecture allows for ease of development and scalability, it also presents a unique challenge in terms of identifying and resolving issues that may arise.
Discovering an issue within your code, whether through personal observation or client feedback, can be an unpleasant experience. The cloud environment, particularly within a distributed and serverless context, can make it challenging to understand the root cause of the problem. As multiple microservices communicate with each other, it is difficult to gain a comprehensive view of the entire application. Moreover, recreating the same situation locally is almost impossible. The situation is compounded by the dynamic nature of the environment, where instances are deployed and removed unpredictably, making it even more challenging to gain visibility into the issue at hand.
Troubleshooting .NET – Current Options
As mentioned earlier, troubleshooting .NET applications can be a very complex task for developers. Within the native IDEs, .NET developers have various options to address issues encountered during the production phase. Here are some of them:
- Crash Dumps can provide insight into why code crashes, but analyzing them requires specific skills. However, crash dumps cannot identify the root cause of the issue leading to the crash.
- Metric and Counters to collect and visualize data from remotely executing code can provide better insights into the system. However, there are limitations to dynamically adjusting the scope of focus to specific variables or methods.
- Logging is a common and straightforward technique to help developers identify issues in running code. It provides a wealth of information, but irrelevant data can be stored, particularly when logging at scale. Consolidating logs into a single service, such as Application Insights, requires accurate filtering to separate important data from the noise. Additionally, static logging does not provide flexibility in what to log or the duration of the logging session.
- Snapshot debugging allows for remote debugging of code within the IDE. When exceptions are thrown, a debug snapshot is collected and stored in Application Insights, including the stack trace. A minidump can also be obtained in Visual Studio to enhance visibility into the issue’s root cause. However, this is still a reactive solution that requires a more proactive approach to problem-solving. It also only works on specific ASP.NET applications.
- Native IDE Debuggers – built-in debuggers like the one that comes with the JetBrains Rider IDE is good for local debugging, however, it has few drawbacks. It stops the running app for breakpoints and other new telemetry collections, and cannot really help with complex recreation of production issues.
Live Debugging of .NET Applications with Lightrun!
Lightrun provides a unique solution for developers who want to improve their code’s observability without the need for code modifications during runtime. The magic ingredient is the Lightrun agent that enables dynamic logging and observability that is added to the solution in the form of a NuGet package. Once included, it is initialized in your application starting code. And that is it. From there, the Lightrun agent takes care of everything else. And by that, it means connecting to your application at any time to retrieve logs and snapshots (virtual breakpoints) on an ad-hoc basis, without the unnecessary code modification/instrumentation, going through the rigorous code changes approval process, testing and deployment.
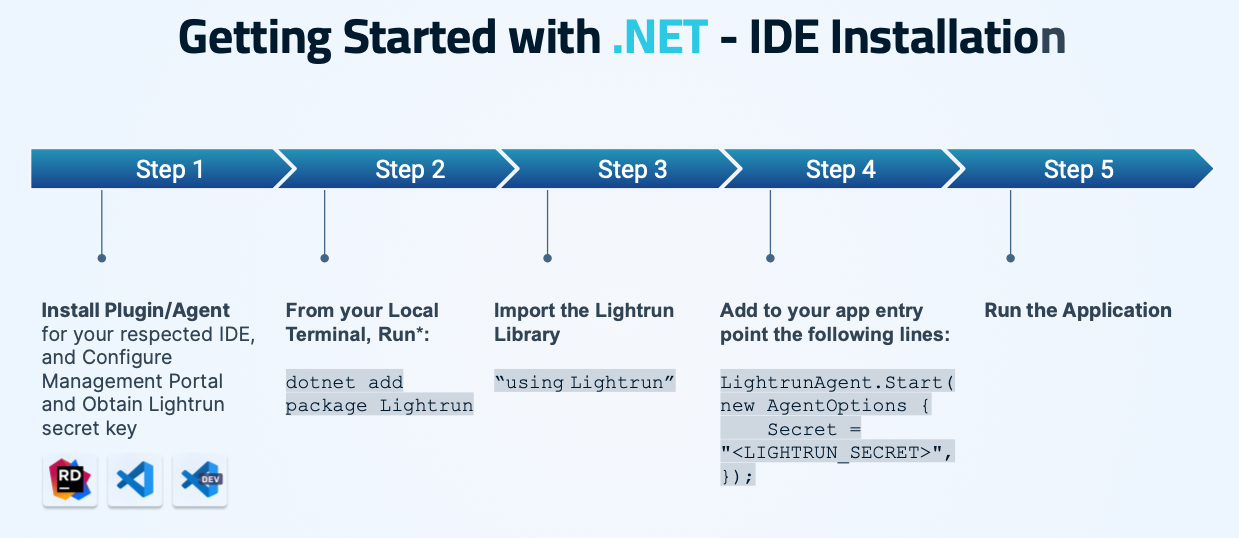
Getting Started with Lightrun for .NET within VSCode and Rider IDEs
As shown in the below workflow diagram, .NET developers can get started with Lightrun by following the 5 simple steps.
Detailed Step by Step Instructions: VS Code IDE
STEP 1: Onboarding and Installation
To get started with Lightrun for .NET in VS Code IDE, create a Lightrun account.
Then follow the below steps to prepare your C# application to work with Lightrun (Code sample is available in this Github repository).
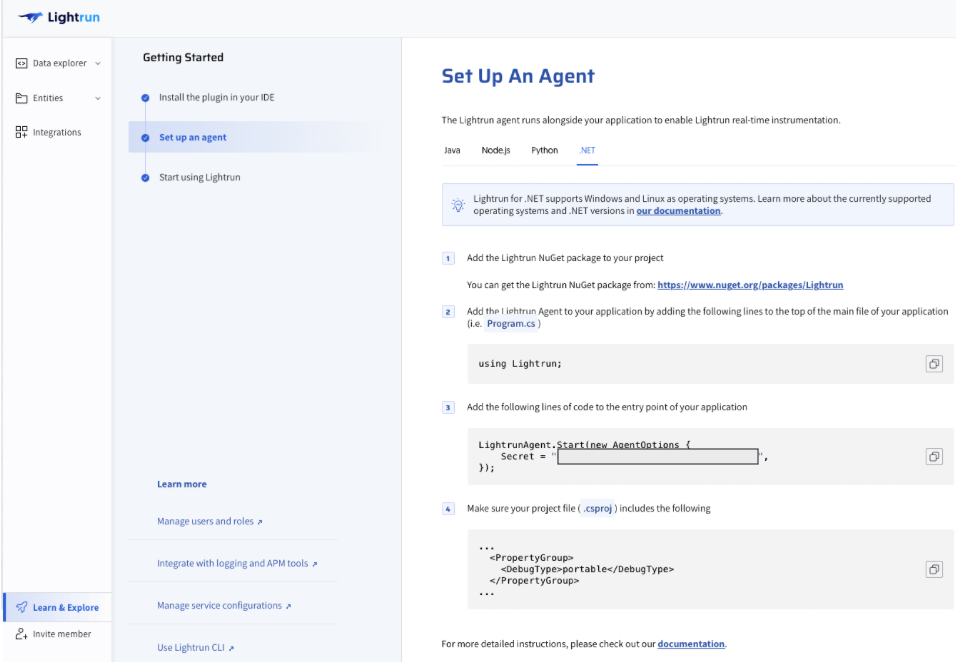
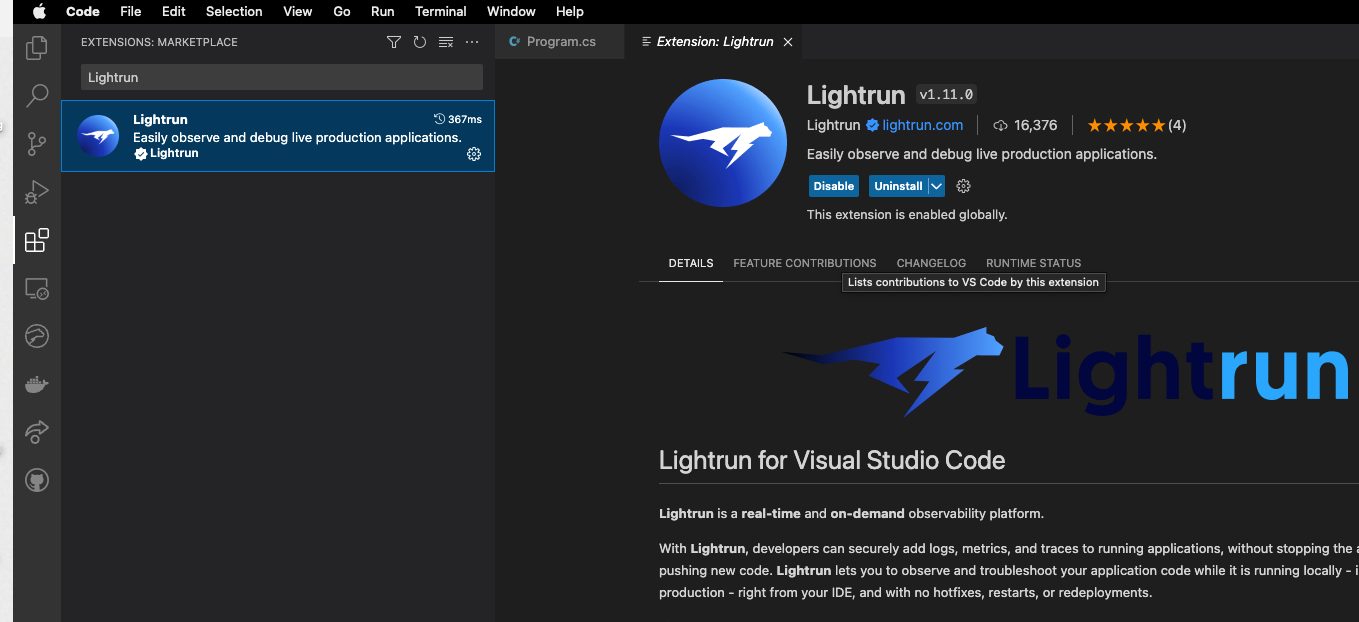
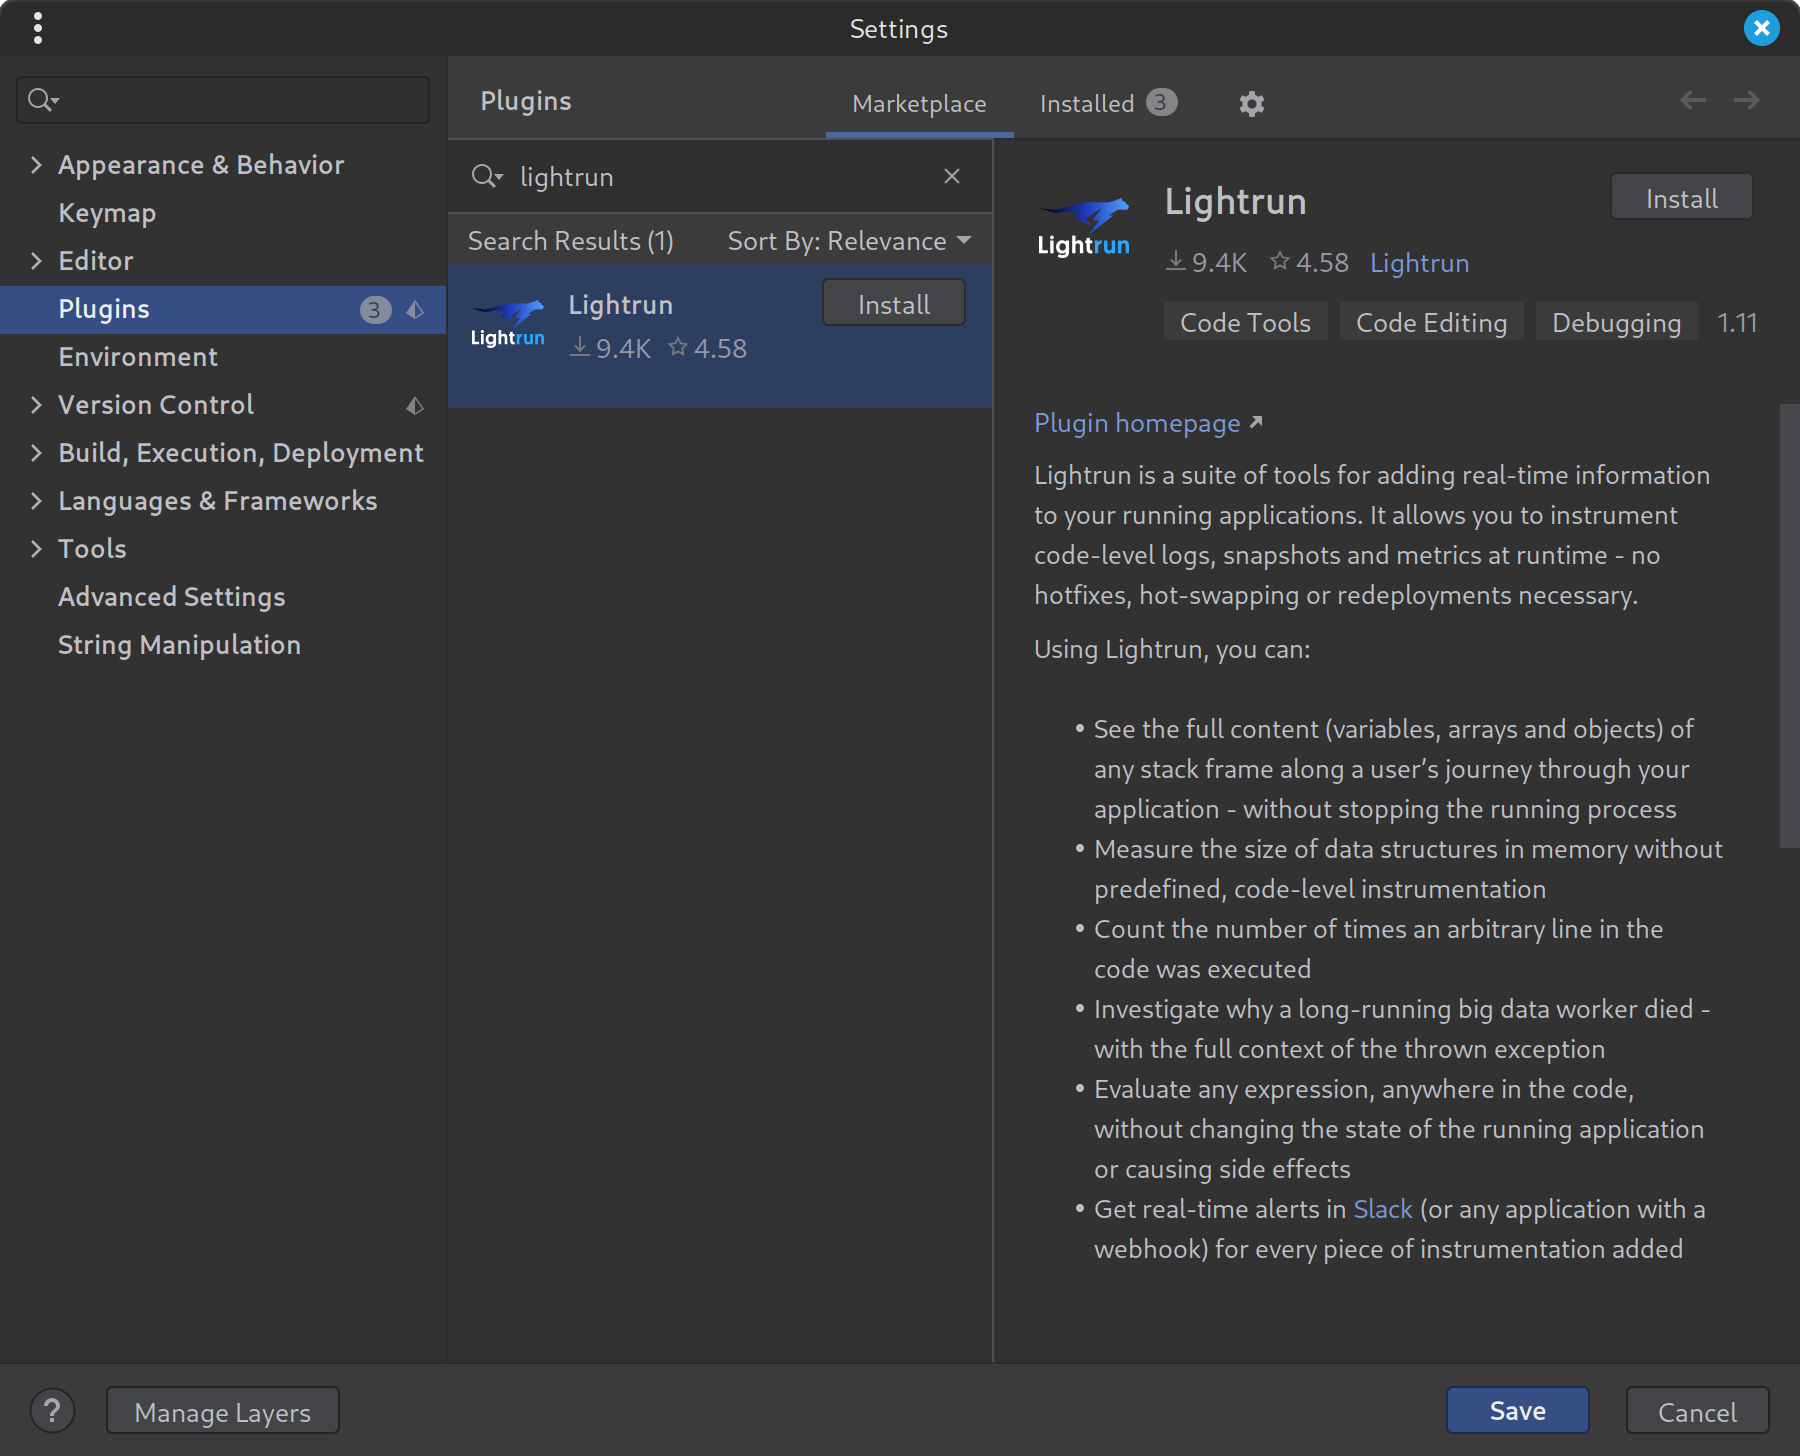
Once you’ve obtained your Lightrun secret key from the Lightrun management portal (https://app.lightrun.com), please install the VS Code IDE plugin from the extensions marketplace as shown in the below screenshot.
Post the IDE plugin installation and your user authentication, you should be able to start troubleshooting your C# application directly from your IDE by running it from either your IDE, command-line, or GitHub Actions.
STEP 3: Snapshots
From the VS Code IDE, run your C# application. Once the app is running, developers can add virtual breakpoints (called Lightrun Snapshots) without the need to stop the running app as well as add dynamic and conditional logs.The below screenshot shows how a Lightrun snapshot would look inside the VS Code plugin, and how it provides the developers with the full variable information and call stack so they can quickly understand what’s going on and resolve the issues at hand.
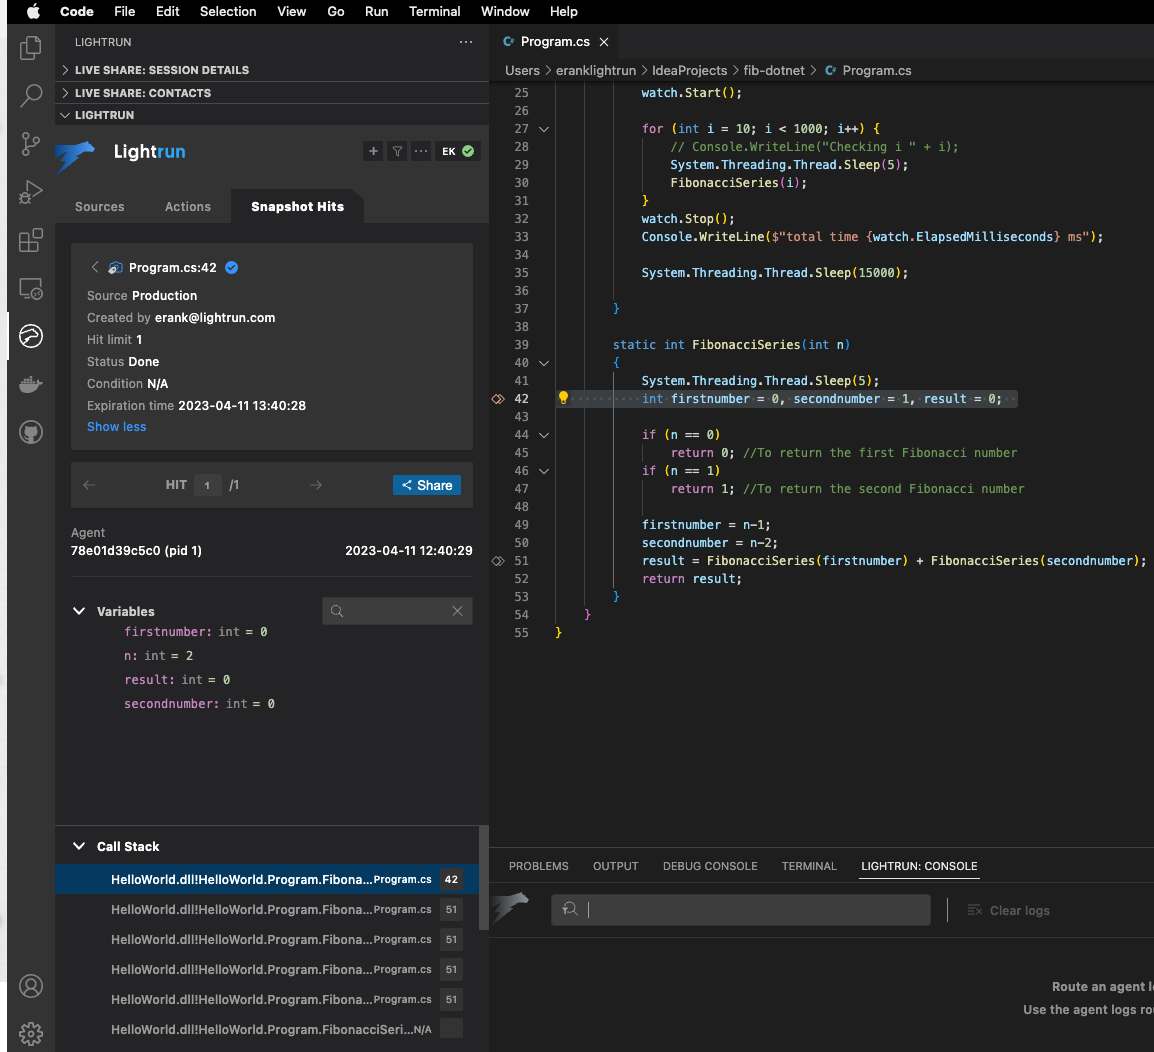
The above example demonstrates a Lightrun snapshot hit on the C# Fibonacci application (line 42).
STEP 4: Conditional Snapshots
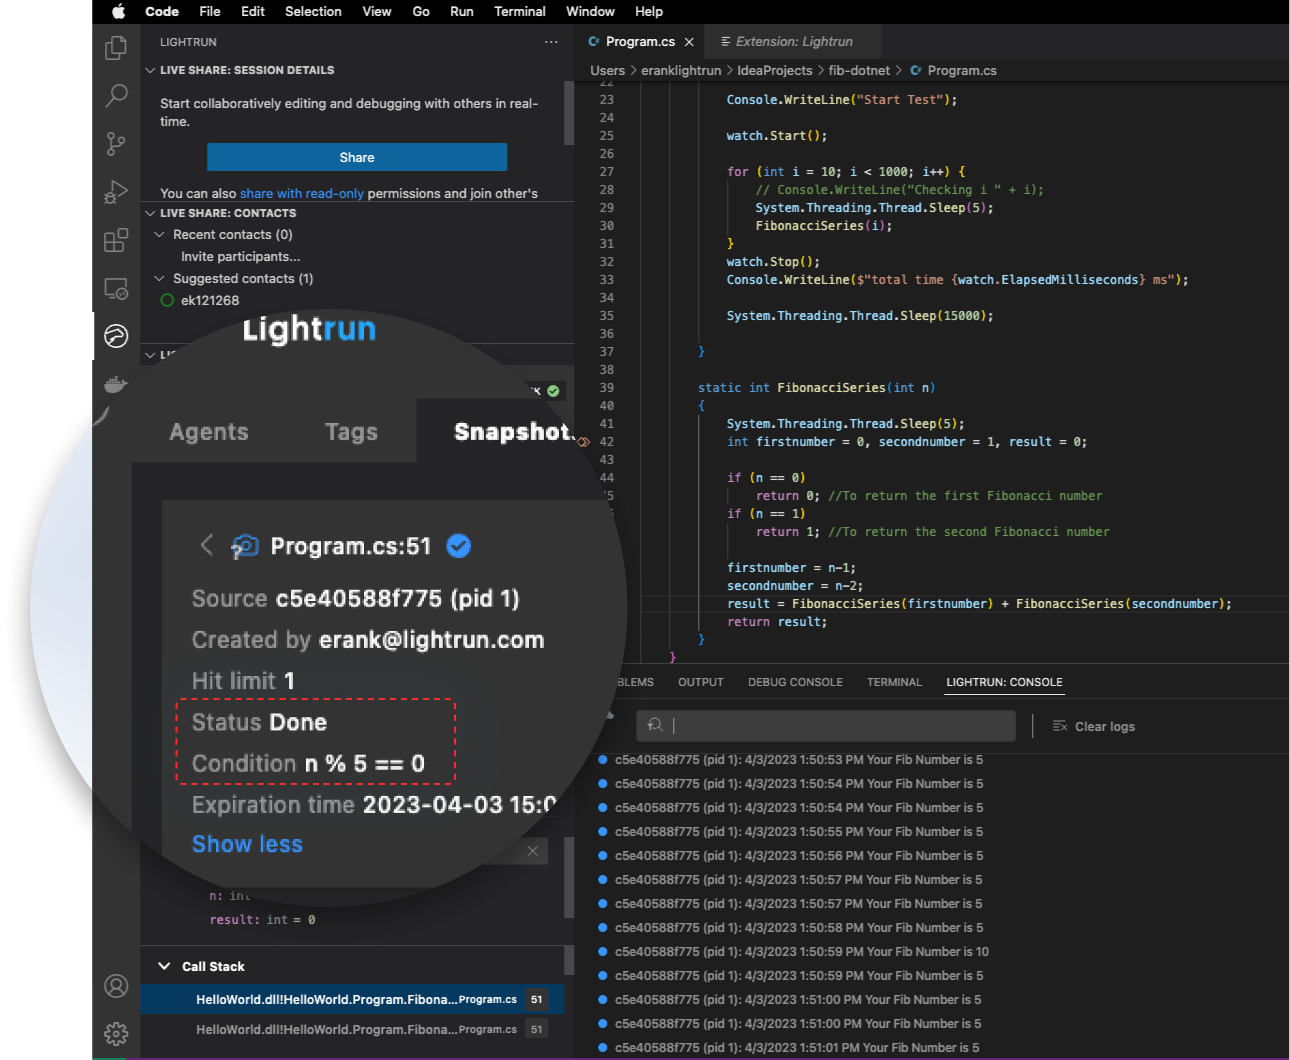
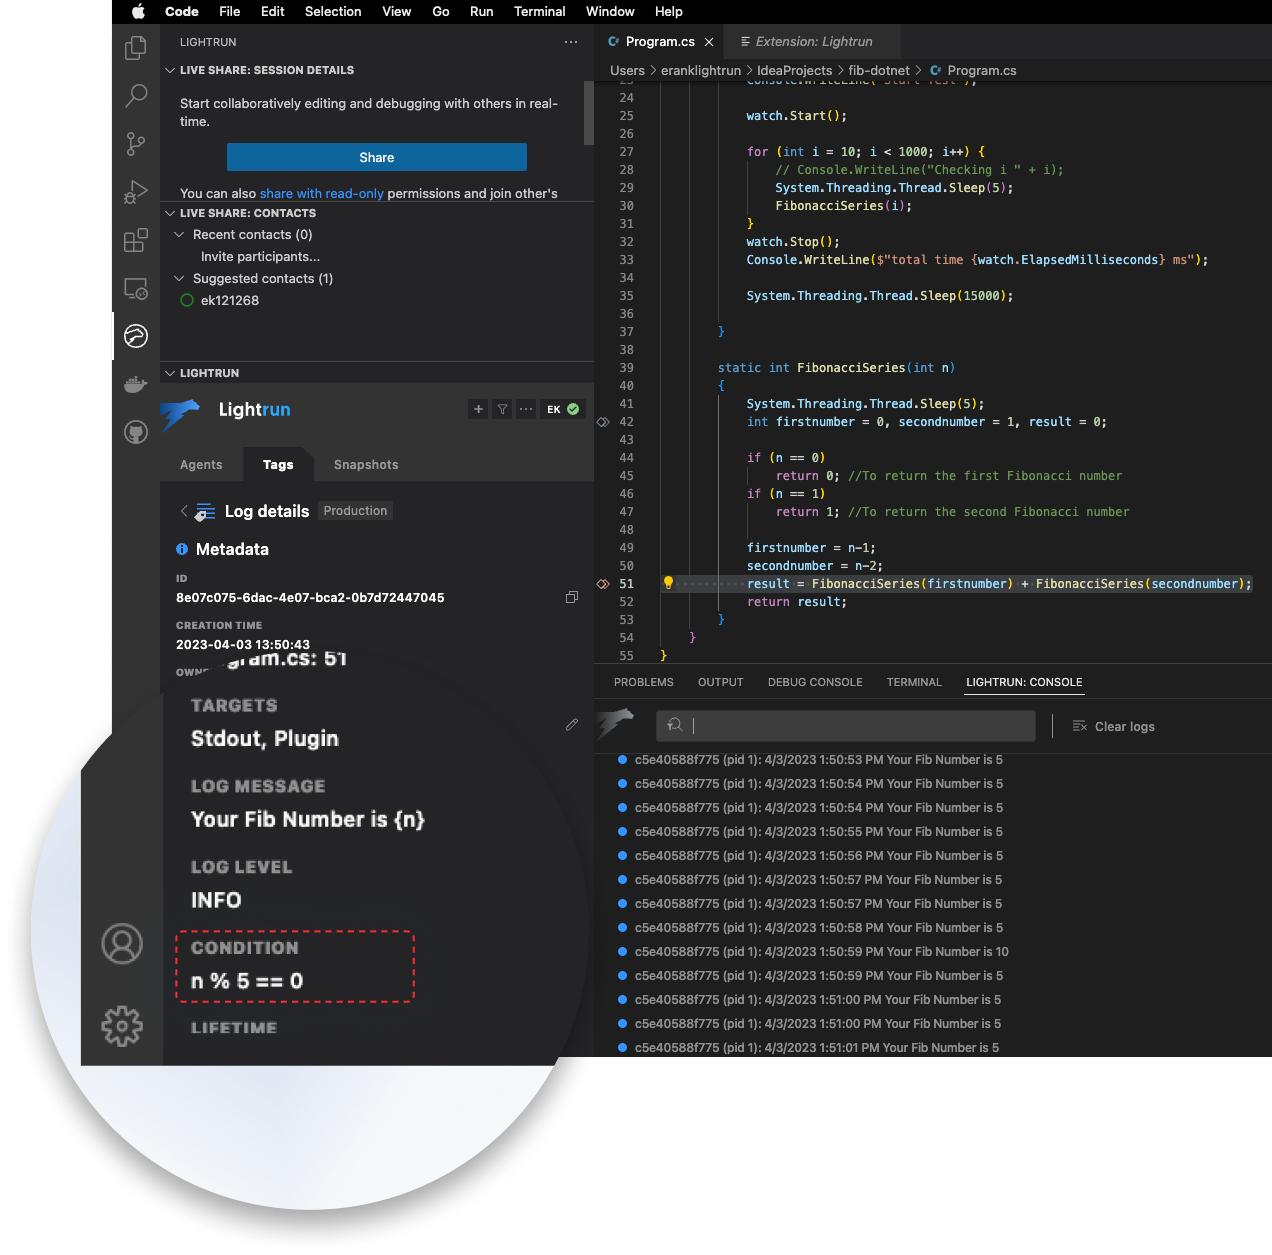
In the same way developers can use the Lightrun plugin to add snapshots, they can also include conditions to validate specific use cases throughout the troubleshooting workflow. As seen in the below example, developers can add a conditional snapshot that only captures the fibonacci number that is divisible by 5 (line 51 in the Fibonacci code sample).
STEP 5: Logs
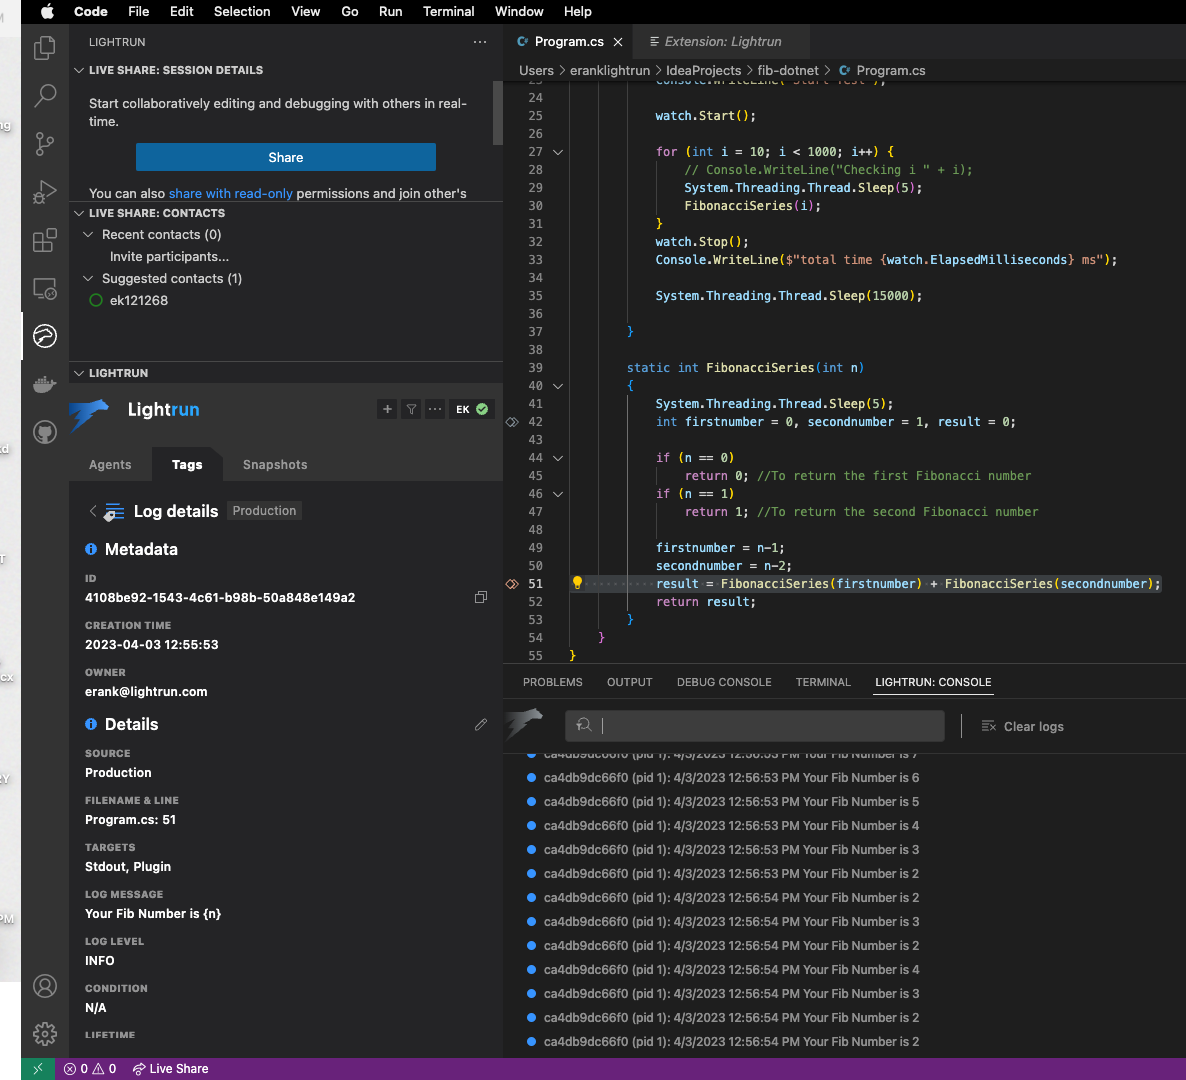
Below screenshot shows how a log could be used within the VS Code IDE plugin to gather specific variable outputs that could be piped into the Lightrun IDE console or the STDout. Such troubleshooting telemetry can be also easily shared from within the plugin via Slack, Jira, or a simple URL as a way of facilitating cross-team collaboration.
Step 6: Conditional Logs
To add a condition to the troubleshooting logs output, you can use the conditional logs field within the IDE plugin as shown below. For the fibonacci code sample, we can only pipe to the Lightrun console the numbers (n) that are divisible by 5 (n % 5 == 0).
Detailed Step by Step Instructions: Rider IDE
In a similar method like with the VS Code IDE, developers can follow the steps below within the Rider IDE and troubleshoot their C# applications.
STEP 1: Onboarding and Installation
To get started with Lightrun for .NET in Rider IDE, create a Lightrun account.
Then follow the below steps to prepare your C# application to work with Lightrun.
Once you’ve obtained your Lightrun secret key from the Lightrun management portal as noted above, please install the Rider IDE plugin from the extensions marketplace as shown in the below screenshot.
Post the IDE plugin installation and your user authentication, you should be able to start troubleshooting your C# application directly from your IDE by running it from either your IDE, command-line, or GitHub Actions.
STEP 3: Snapshots
Within the Lightrun Rider IDE once the application is running, developers can add virtual breakpoints (called Lightrun Snapshots) without the need to stop the running app as well as add dynamic and conditional logs.The below screenshot shows how a Lightrun snapshot would look inside the VS Code plugin, and how it provides the developers with the full variable information and call stack so they can quickly understand what’s going on and resolve the issues at hand.
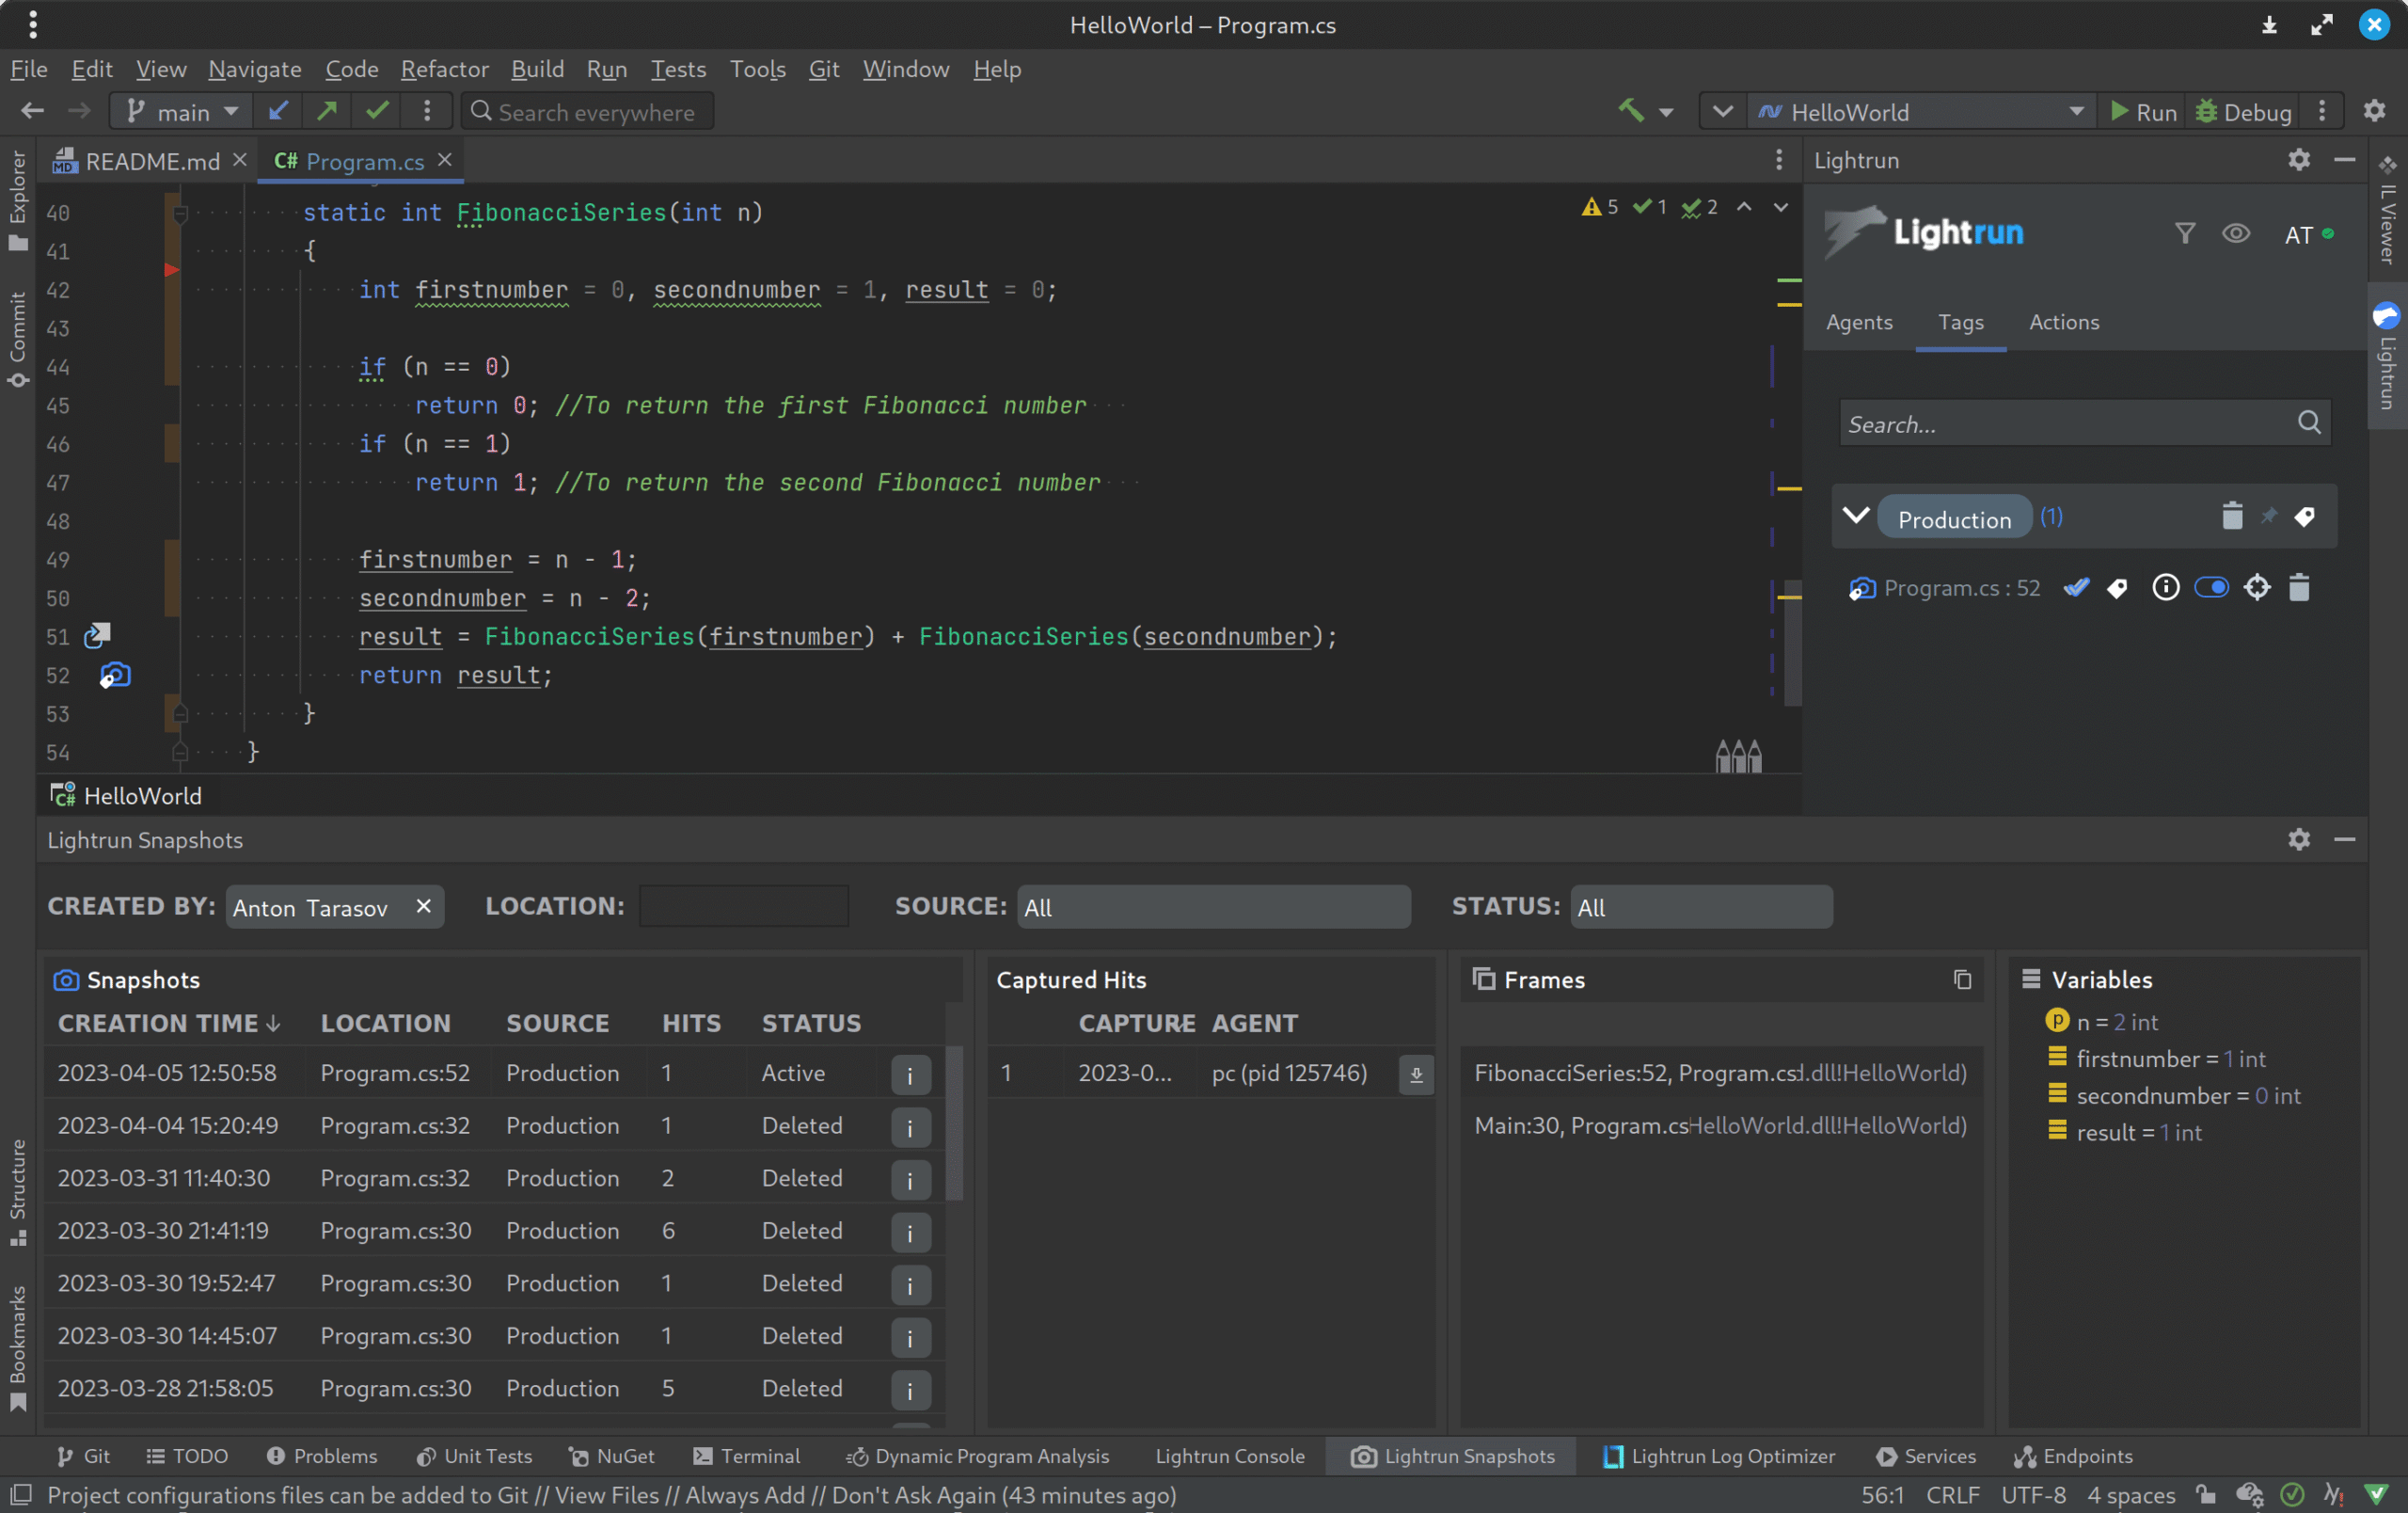
The above example demonstrates a Lightrun snapshot hit on the C# Fibonacci application (line 52).
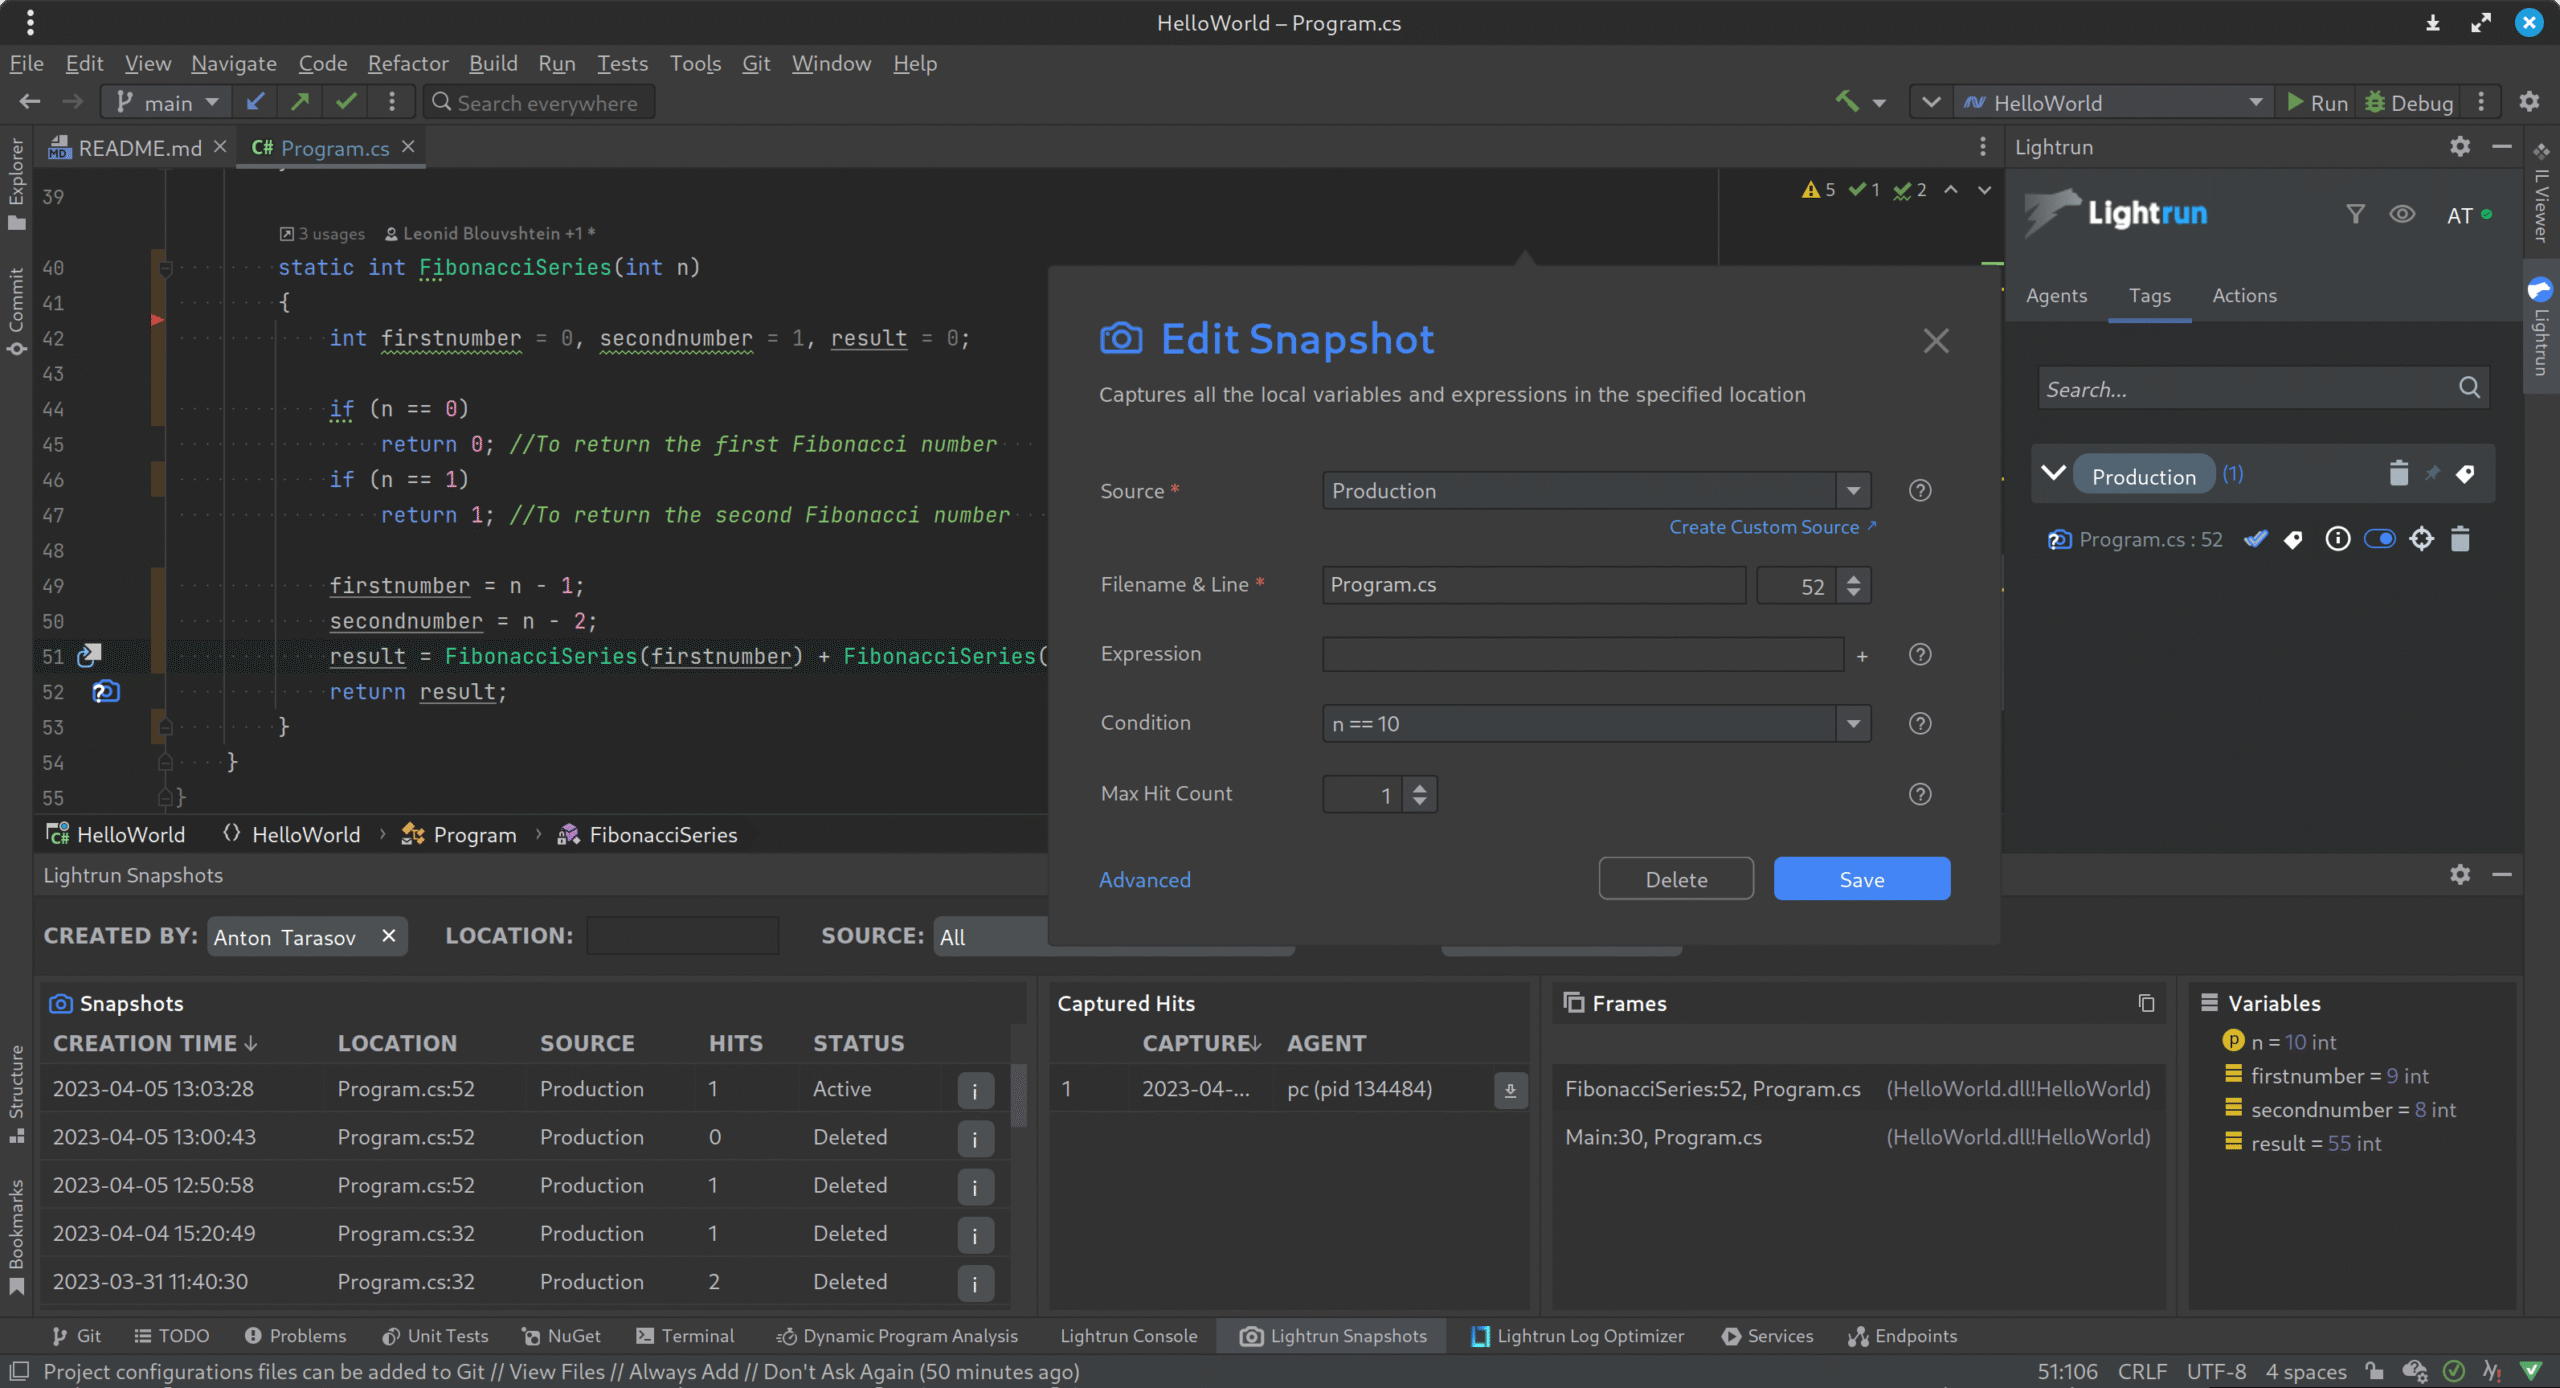
STEP 4: Conditional Snapshots
In the same way developers can use the Lightrun plugin to add snapshots, they can also include conditions to validate specific use cases throughout the troubleshooting workflow. As seen in the below example, developers can add a conditional snapshot that only captures the fibonacci number that is divisible by 10 (line 52 in the Fibonacci code sample).
STEP 5: Logs
Below screenshot shows how a log could be used within the VS Code IDE plugin to gather specific variable outputs that could be piped into the Lightrun IDE console or the STDout. Such troubleshooting telemetry can be also easily shared from within the plugin via Slack, Jira, or a simple URL as a way of facilitating cross-team collaboration.
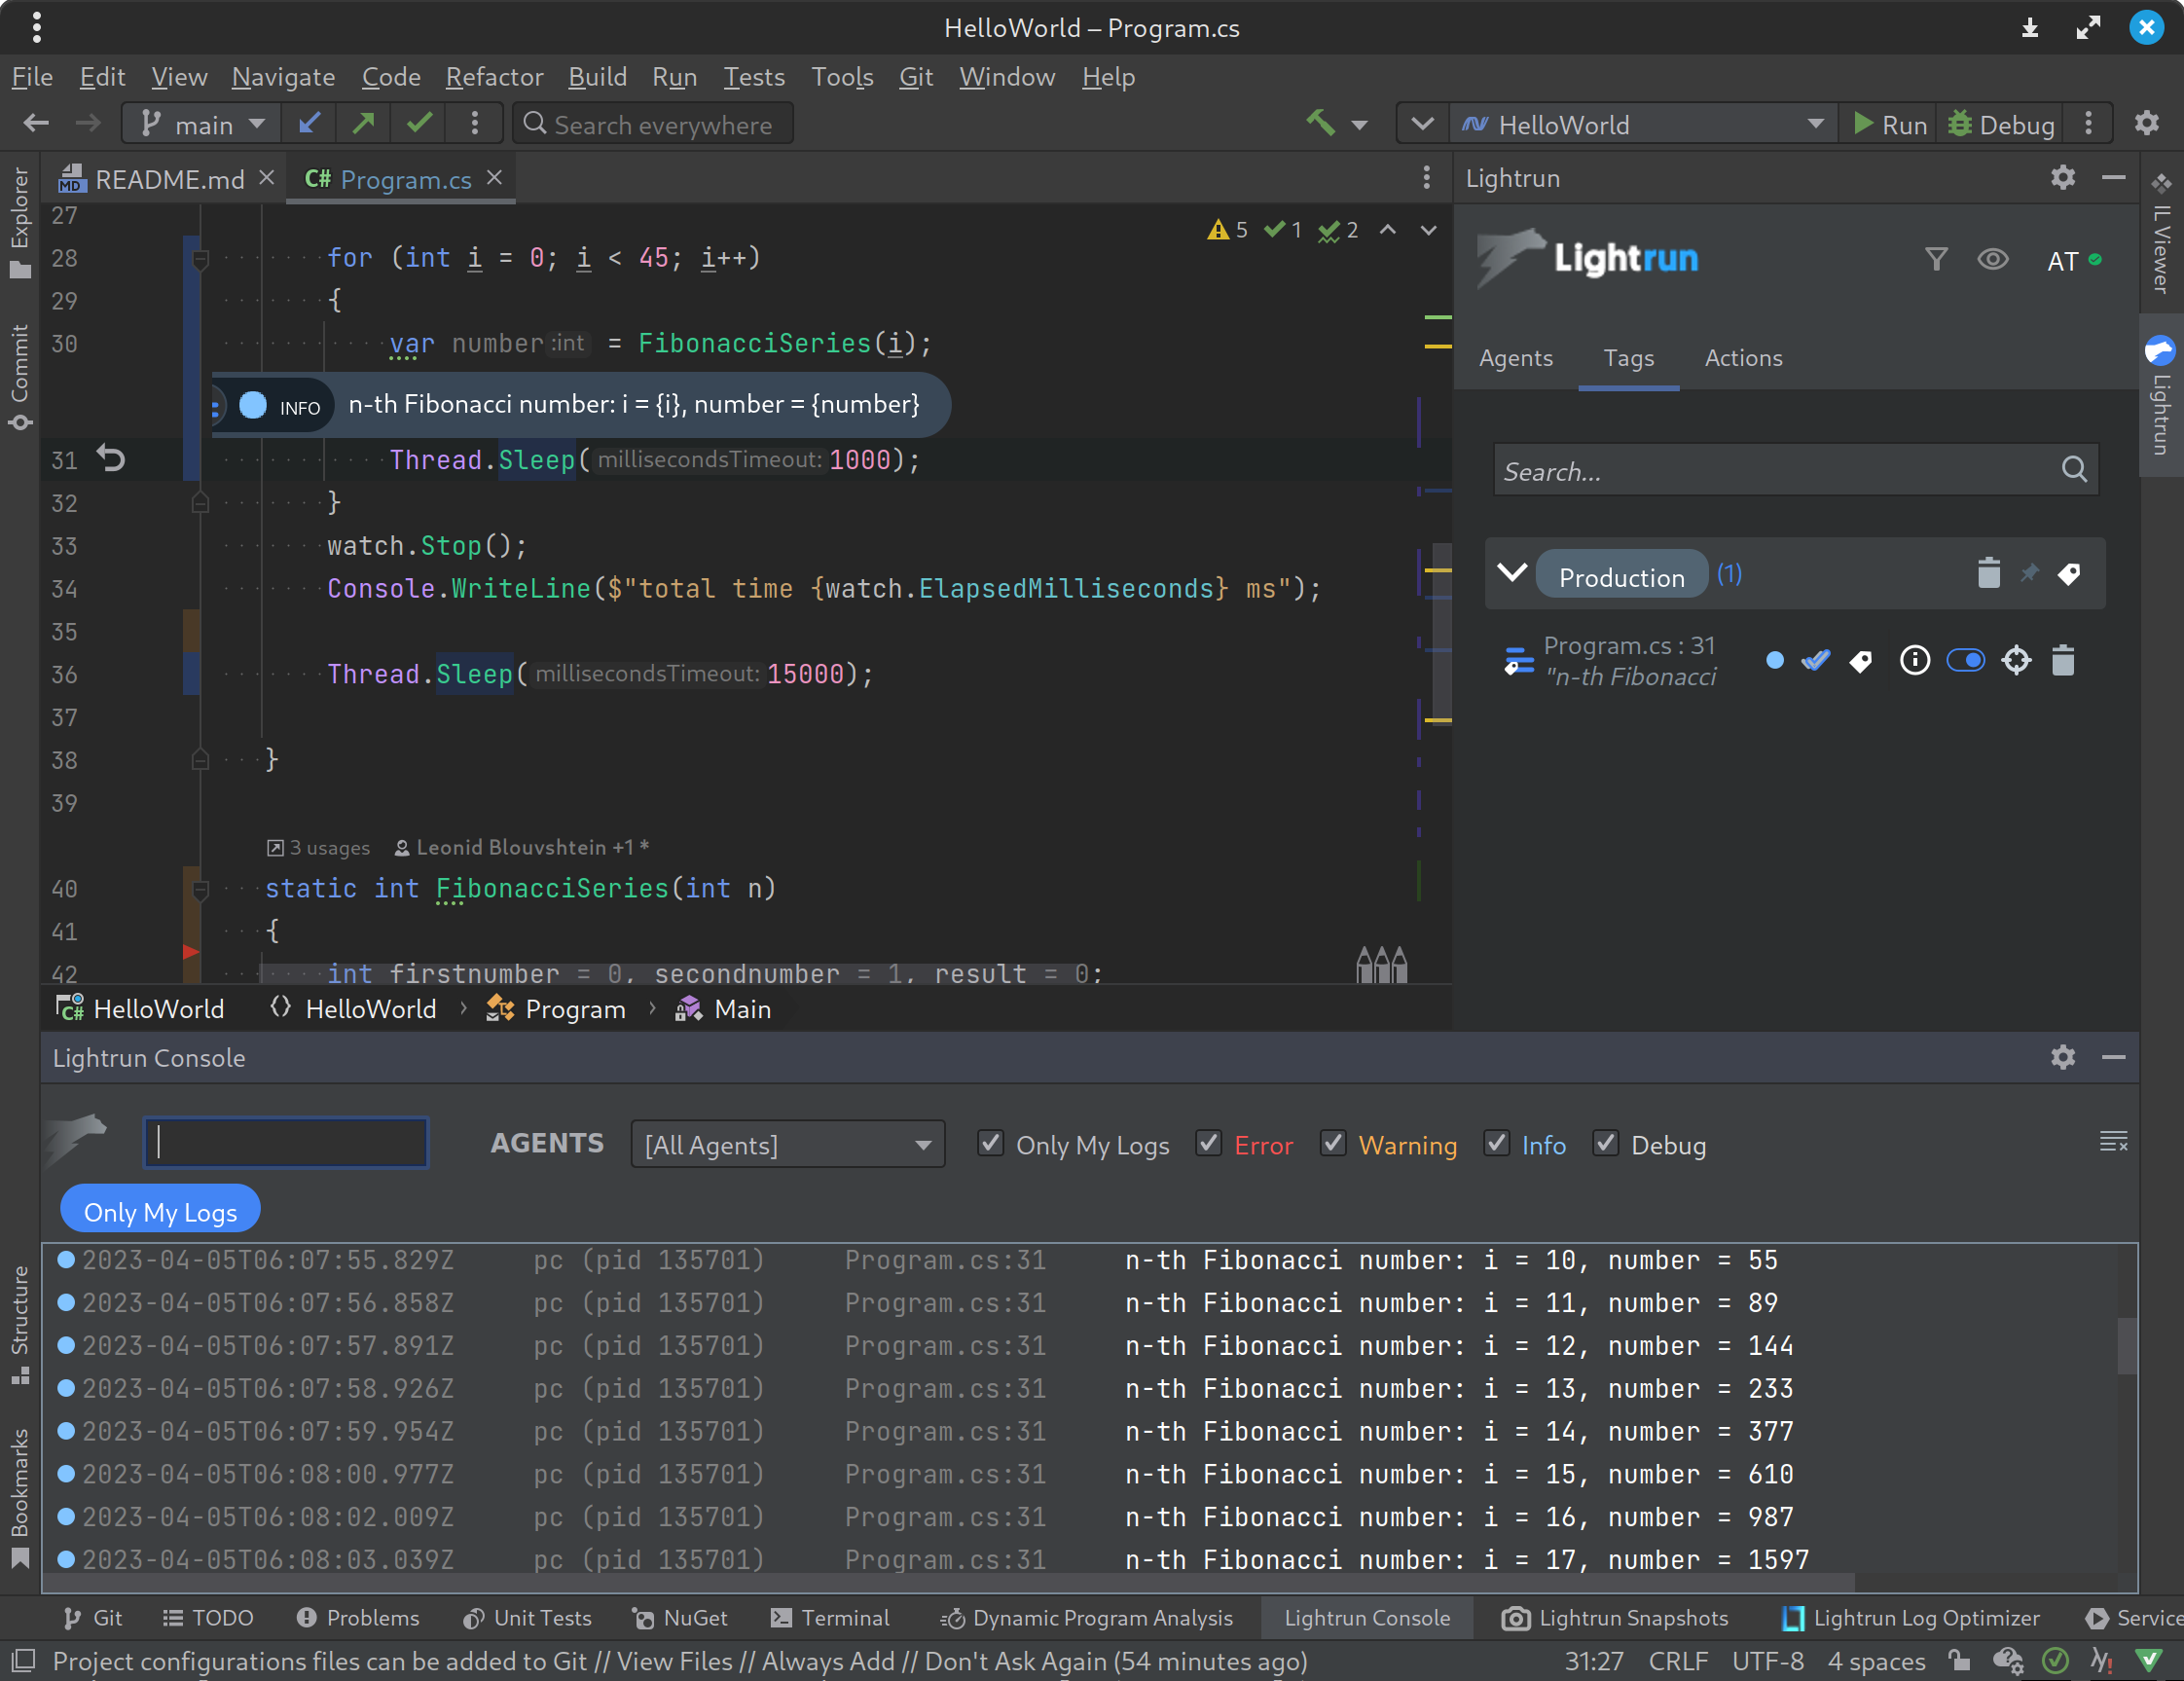
The above example demonstrates a Lightrun logpoint that was added to the C# Fibonacci application (line 31) and the log output displayed in the dedicated Lightrun console.
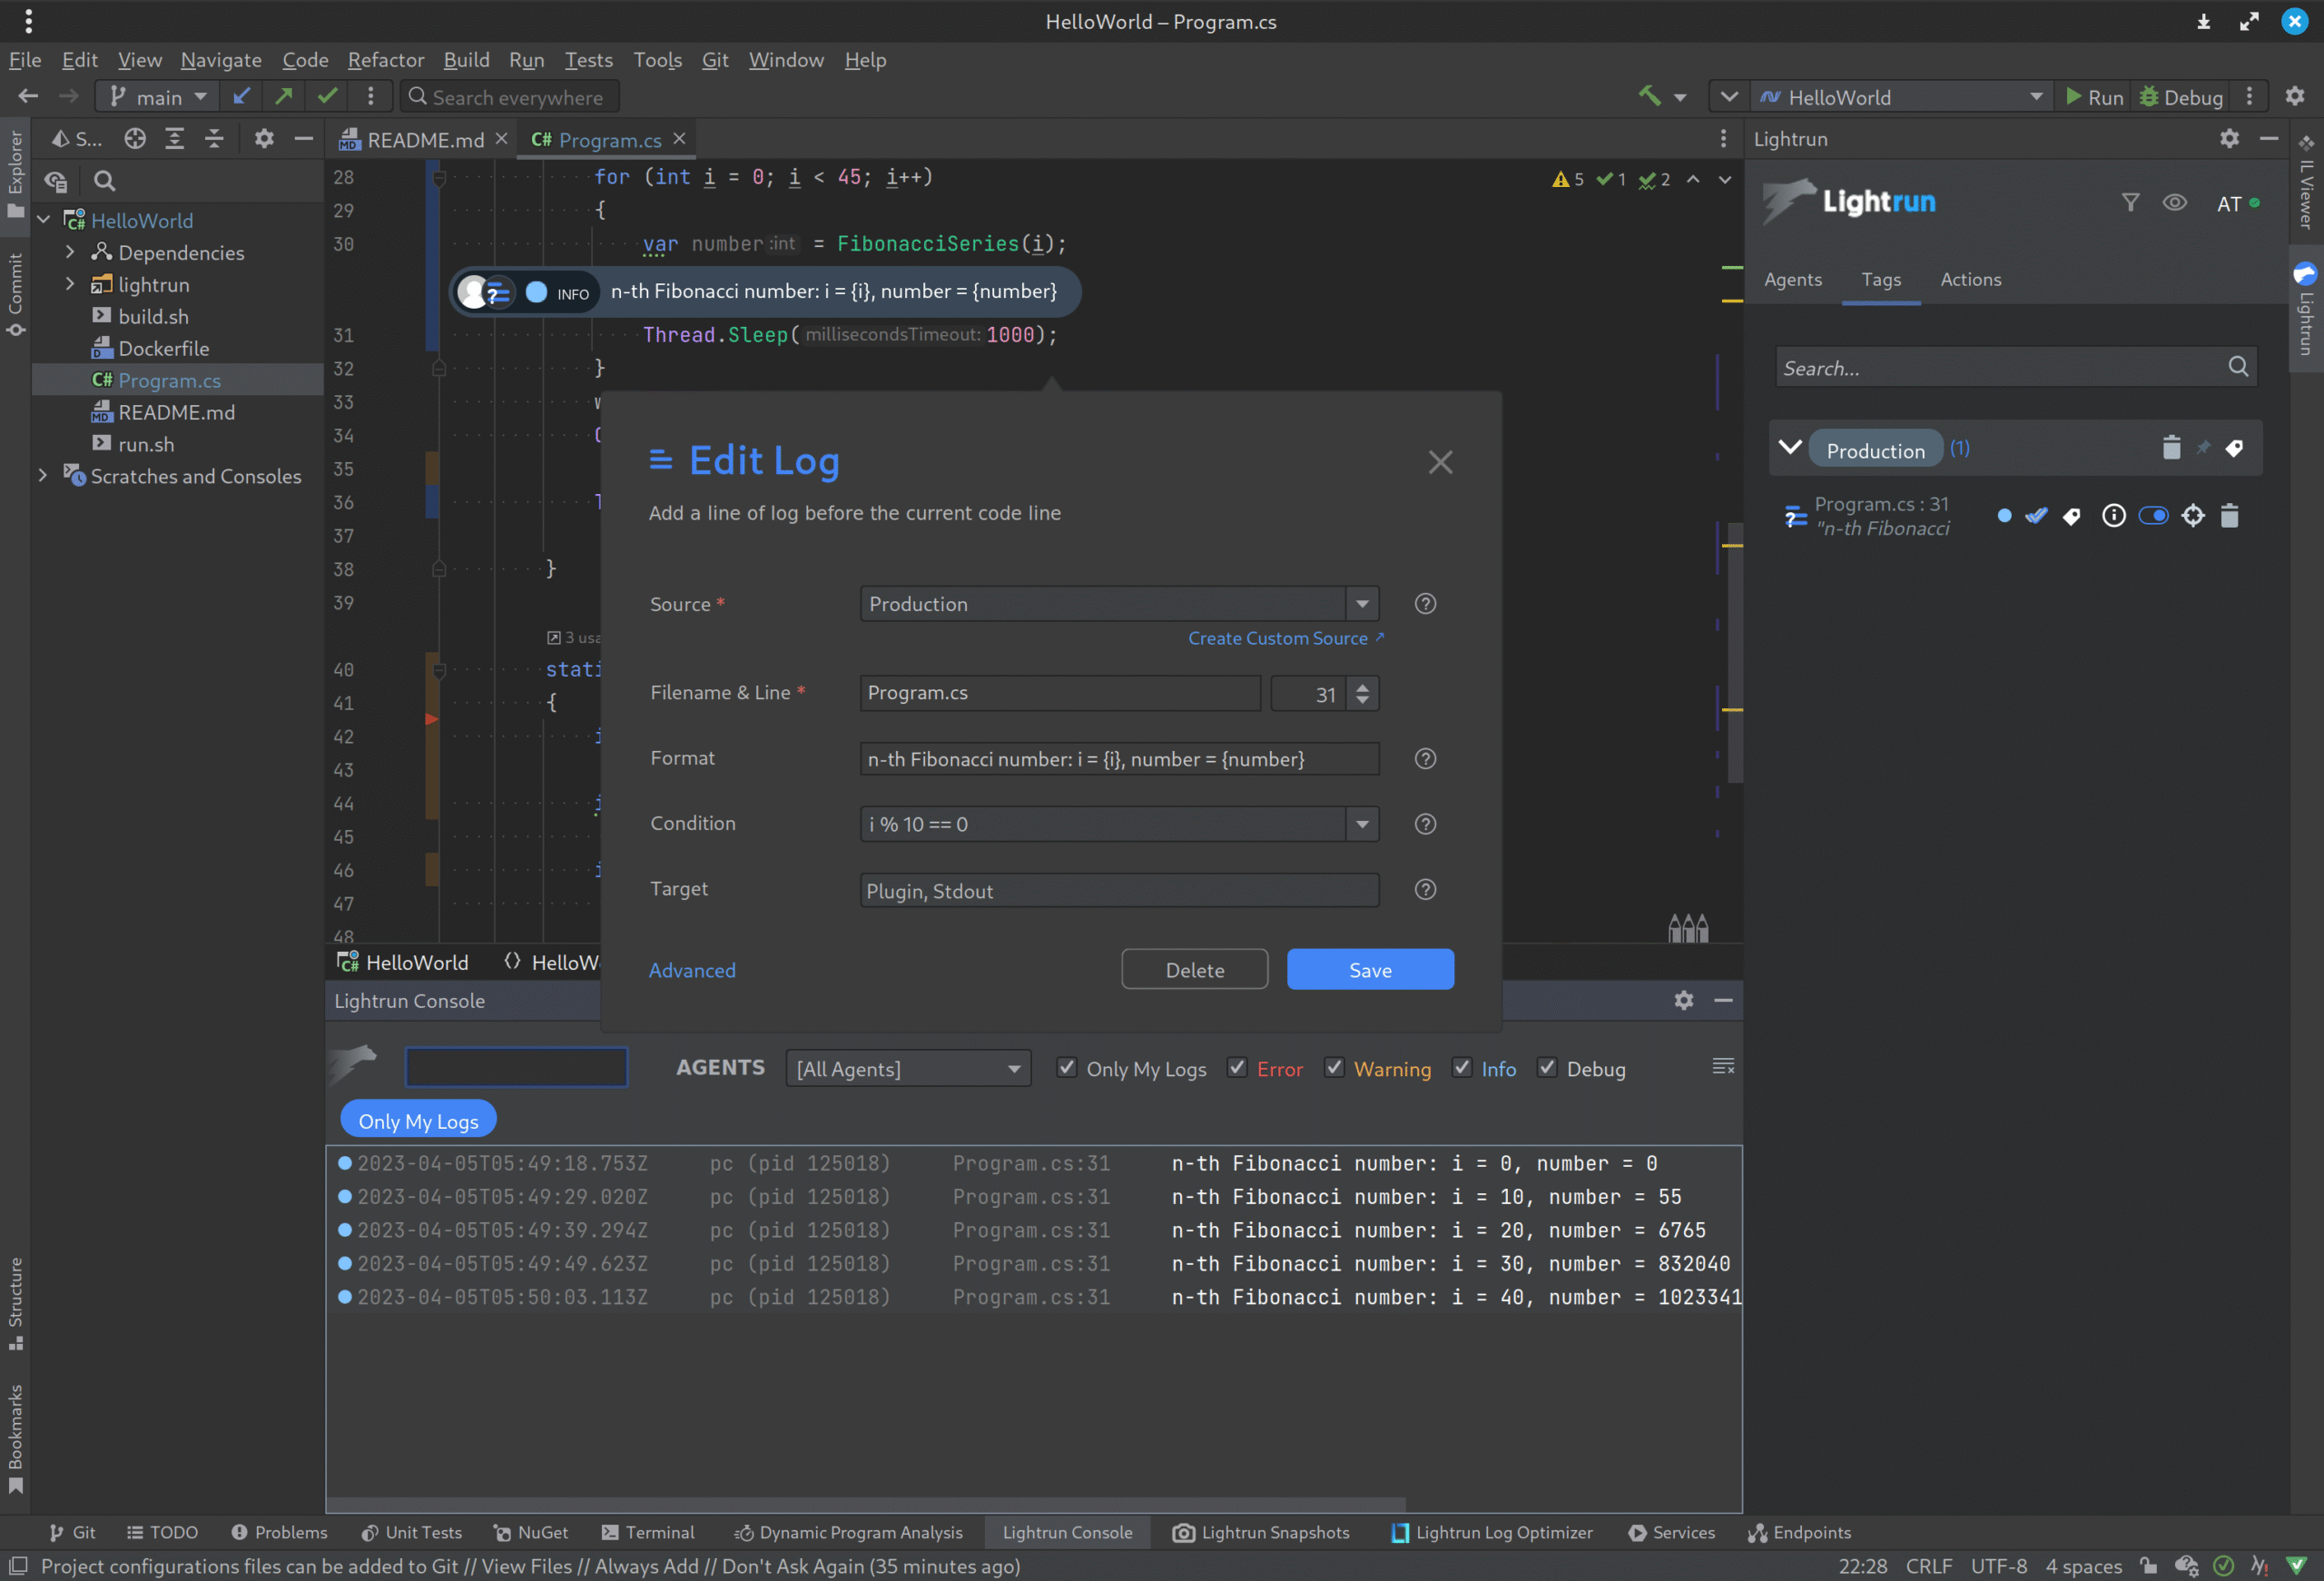
Step 6: Conditional Logs
To add a condition to the troubleshooting logs output, you can use the conditional logs field within the IDE plugin as shown below. For the fibonacci code sample, we can only pipe to the Lightrun console the numbers (n) that are divisible by 10 (i % 10 == 0).
Bottom Line
With Lightrun, developers can identify and resolve issues proactively, reducing downtime, and enhancing the user experience while also reducing overall costs of logging. If you’re a .NET developer looking to simplify your debugging process, give Lightrun a try and experience the difference it can make in your development workflow.
To see it live, please book a demo here!