Top 5 Debugging Tips for Kubernetes DaemonSet
Kubernetes is the most popular container orchestration tool for cloud-based web development. According to Statista, more than 50% of organizations used Kubernetes in 2021. This may not surprise you, as the orchestration tool provides some fantastic features to attract developers. DaemonSet is one of the highlighted features of Kubernetes, and it helps developers to improve cluster performance and reliability. Although it is widely used, debugging DaemonSet can be challenging since it is in the application layer. So, this article will discuss five essential tips to help you debug Kubernetes DaemonSet.
What is a Kubernetes DaemonSet?
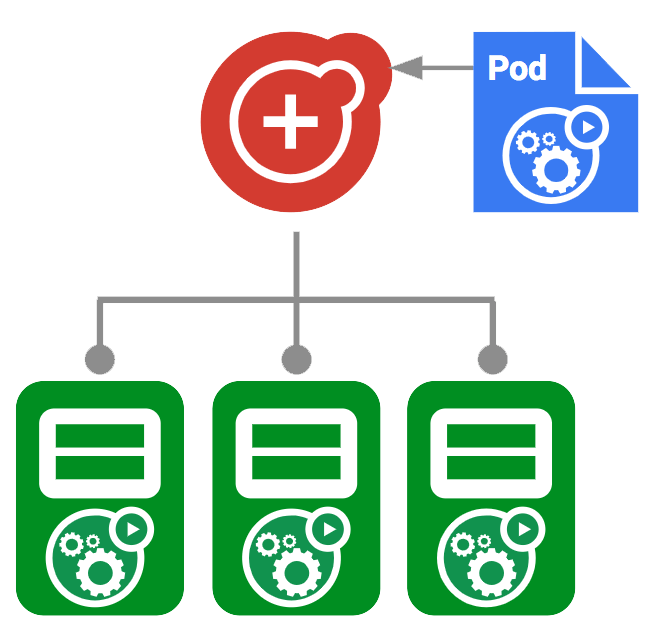
Kubernetes DaemonSet is a Kubernetes object that ensures all nodes (or selected subset) in a cluster run a single copy of a pod.
When you add new nodes to a cluster, the DaemonSet controller automatically adds a pod to that node. Similarly, pods will be erased when a node is deleted from the cluster.
Most importantly, DaemonSet improves the performance and reliability of your Kubernetes cluster while distributing tasks across all nodes. Some developers argue that we do not need to consider where pods run on a Kubernetes cluster. But DaemonSet is efficient for long-running services like log collection, node monitoring, and cluster storage. Also, you can create multiple DaemonSets for a single type of daemon using different flags, memory capacities, and CPU requests.
Taints and tolerations for DaemonSet
Taints and tolerations are used together to stop pods from scheduling onto inappropriate nodes. You can apply one or more taints to a node, and it will not allow the node to accept pods that do not tolerate the taints. On the other hand, tolerations enable the scheduler to find nodes with matching taints and schedule pods on them. However, using tolerations does not ensure scheduling.
Top 5 debugging tips for Kubernetes DaemonSet
Now that we have a broad understanding of Kubernetes DaemonSet, let’s discuss a few tips you can use to ease the Kubernetes DaemonSet debugging process.
1. Find unhealthy pods
A DaemonSet is considered unhealthy when it does not have one pod running in each node. Unhealthy DaemonSets are caused mainly by pending pods or pods stuck in a crash loop.
You can easily find unhealthy pods in a Kubernetes cluster by listing all the available pods. The below command will list all the pods in the cluster with their statuses.
kubectl get pod -l app=[label]
You can identify the unhealthy pods from their status once they are listed. Pods withcrashloopbackoff, pending, and evicted statuses are considered unhealthy. Once you identify the unhealthy pods, you can use the below commands to get more details and logs on the pod.
// Get more information about the pod
kubectl describe pod [pod-name]

// Get pod logs
kubectl logs [pod-name]
Finally, you can use the pod information and logs to determine the issue in the DaemonSet. This approach saves you a lot of time since you do not need to debug all the pods in the cluster to find the problem. You can prioritize the unhealthy pods first.

2. Resolve the nodes that don’t have enough resources
As mentioned, pods with crashloopbackoff status are considered unhealthy pods. Mainly, this error is caused by a lack of resources available to run the pod. You can follow the below steps to troubleshoot pods quickly with crashloopbackoff status.
First, you need to find the node that runs the unhealthy pod:
kubectl get pod [pod-name] -o wide Then, you can use the node name from the above command result to monitor the available node resources:kubectl top node [node-name]If you notice a lack of resources in the node, you can resolve it by:
- Decreasing the memory and CPU of the DaemonSet.
- Upgrading nodes to accommodate more pods.
- Moving affected pods to another node.
- Using taints and tolerations to prevent pods from running on nodes with lower resources.
However, if you don’t notice a lack of resources in the node, you will have to check node logs and investigate the pod command to find the issue.
3. Identify container issues
If you can’t find any issues in the pods, the error might be caused by a container within a pod. Using the wrong image is the main reason for container issues. So, first, you need to find the image name from the DaemonSet manifest and verify that you have used the correct image.
If it is not the case, you will have to log into the node through the command line and investigate if there are any application or configuration issues. You can use the below command to gain access to a Kubernetes cluster node through the command line:
docker run -ti --rm ${image} /bin/bash4. Use Kubectl commands for troubleshooting
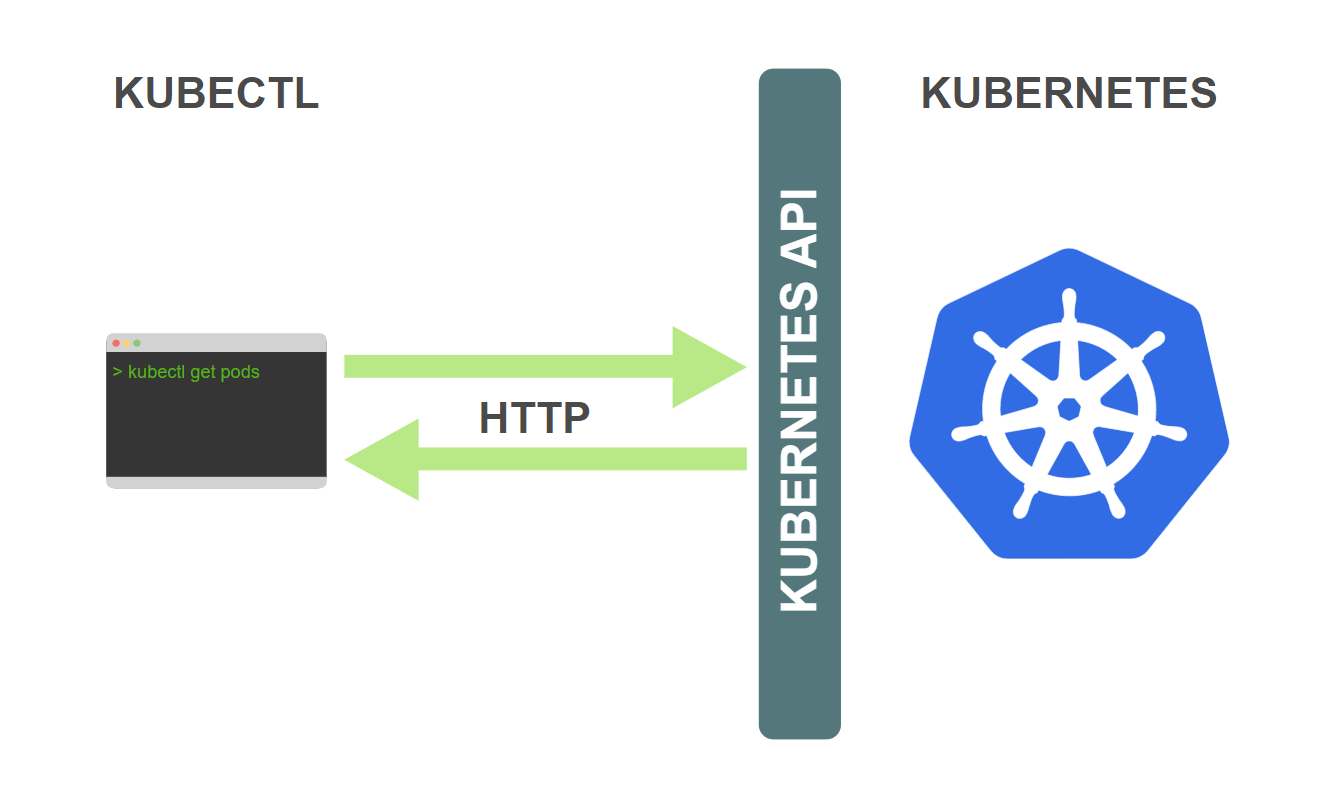
Using Kubectl commands is another excellent approach to debugging Kubernetes DaemonSets. Kubectl is a command line tool provided by Kubernetes to communicate easily with Kubernetes clusters. You can use it to perform any action on a cluster, including deploying apps and managing cluster resources. Most importantly, you can use Kubectl on Windows, macOS, and multiple varieties of Linux.
Here are some of the most popular Kubectl commands you can use to debug DaemonSets:
- Kubectl describe – Provides detailed information on deployments, services, and pods. When debugging, you can use this command to fetch details on nodes to identify memory and disk space issues.
- Kubectl logs – Used to display logs from a Kubernetes resource. These logs can be a lifesaver when you need more information to determine an error’s root cause.
- Kubectl exec – You can execute commands in a running container using this command. You can use this command to view configuration, startup scripts, and permissions when debugging.
- Kubectl auth – This is another essential command for debugging. It allows you to verify that a selected user or a group can perform a particular action.
5. Invest in an observability platform
Logs are an essential part of application debugging. It is no different for Kubernetes, and you can add logs as you see fit to make the debugging process more straightforward. However, manually adding logs is not an easy task. It takes a lot of time, and there can be human errors.
The best way to add logs to your application is by using a specialized observability tool like Lightrun. Such tools help developers monitor their applications in real-time, identify issues, and quickly fix them. Using a specialized tool makes the debugging process much more efficient and faster.
Next steps
The five tips we discussed to debug Kubernetes DaemonSet should make the debugging process easier for you. However, debugging DaemonSets is naturally challenging since daemons are placed in the application layer of the workload. It is always more beneficial to use an observability tool like Lightrun to automate some of your work. Lightrun enables you to add logs, metrics, and traces to your Kubernetes clusters and monitor these in real-time while your app is running. You can find more details on how Lightrun works by requesting a demo.
It’s Really not that Complicated.
You can actually understand what’s going on inside your live applications.