7 Steps for Production Debugging in Any Language
Oct 04, 2022 / Updated: Apr 13, 2026


Debugging is an unavoidable part of software development, especially in production. You can often find yourself in “debugging hell,” where an enormous amount of debugging consumes all your time and keeps the project from progressing.
According to a report by the University of Cambridge, programmers spend almost 50% of their time debugging. So how can we make production debugging more effective and less time-consuming? This article will guide you through seven essential steps to optimize your production debugging process.
What is Production Debugging?
Production debugging identifies the underlying cause of issues in an application in a production environment. This type of debugging can also be done remotely, as it might not be practical to debug the program locally during the production phase. These production bugs are more difficult to fix as the developers might not have access to the local environment when the issues arise.
Production debugging starts with diagnosing the type of production bug and logging the application. The logging mechanism of the application is configured to send information to a secure server for further inspection.
Classical Debugging vs. Remote Debugging
In classical debugging, the function you wish to debug runs within the same system as that of the debugger server. This system can be your workstation or a network-accessible machine. Remote debugging is the process of troubleshooting an active function on a system that is reachable via a network connection.
The idea behind remote debugging is to simplify the debugging of distributed system components. Essentially, it is the same as connecting directly to the server and starting a debugging session there. If you are a VS Code user, you will know how much of a life-saver its extensions are. VS Code remote debugging extensions are no exception. In contrast, remote debugging in IntelliJ IDEA is built in.
Modern infrastructure challenges for Production Debugging
Modern infrastructure is more dispersed and consists of various mobile elements, making it more challenging to identify the issue and track the bug’s origin. The more complex the program, the more challenging it becomes to find a bug.
For example, let’s consider serverless computing. The application is detached at the base level, consisting of specialized, controlled infrastructure-hosted programmatic functions. Thus, it is nearly impossible for a developer to perform a debugging procedure under typical circumstances since the program does not execute in a local environment.
Why debug in production?
If developers followed the best programming practices precisely, an application would have no flaws by the time it was released. In such an ideal situation, there won’t be a need for debugging at the production level. However, this is frequently not the case because there are constantly minor problems and bugs that need fixing, making production debugging a continual and time-consuming process.
There are many reasons why we can’t handle these issues locally. Some of these issues won’t even occur in a local setup. Even if you can reproduce the issue in local environments, it’ll be a time-consuming and challenging task. Also, you have to very quickly solve production issues as customers are constantly engaging with the system. Therefore, the recommended solution is to do production debugging to solve production issues.
Production debugging poses various challenges, such as having to troubleshoot the app and disturbing its performance. Moreover, making changes to the program while it is running might lead to unanticipated outcomes for users and interfere with their overall user experience. You can overcome these potential troubleshooting issues with a debugging tool like Lightrun.
Don’t give up on production debugging just yet! You can take some approaches to make this process a lot easier.
7 essential tips for production debugging in any language
1. Stress test your code
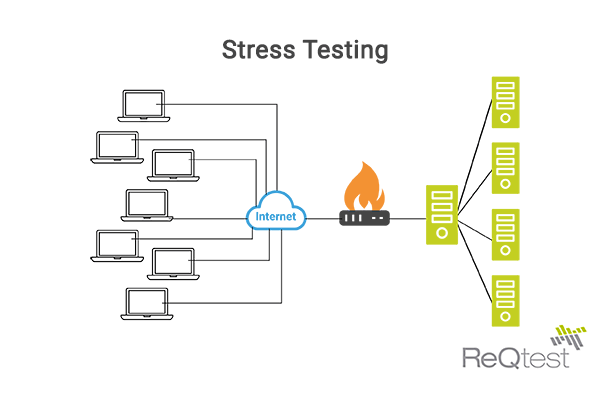
Stress testing involves putting an application under extreme conditions to understand what will happen in the worst-case scenario. Testers create a variety of stress test scenarios to assess the resilience of software and fix any bugs. For example, stress testing shows how the system behaves when many users access the application simultaneously. Furthermore, it examines how the app manages simultaneous logins and monitors system performance while there is a lot of user traffic.
Stress testing may resolve these problems before you make the program available to consumers. It ensures a positive user experience even during periods of high user traffic.
2. Document external dependencies
The “README” file in the source system must include a detailed description of each external requirement. This document will be helpful to anyone who works with this program in the future and needs to understand the required resources to operate it efficiently.
3. Define your debugging scope
This step attempts to pinpoint precisely where in the app the error occurred. By determining your scope beforehand, you avoid wasting time reviewing every single line of code of an application or troubleshooting irrelevant services.
Instead, you focus on a specific part of the app where the bug may be located. Finding a minor bug in 10000 lines of code isn’t feasible, so you should aim to find bugs in the smallest possible scope.
4. Ensure all software components are running
Ensure that software components, including web servers, message servers, plugins, and database drivers, are functioning well and running the most recent updates before starting the debugging process. This ensures that no software elements are to blame for the errors. If all software components are functioning correctly, you may begin to investigate the problem by using logs.
5. Add a balanced number of logs
Logs can be inserted into code lines, making it simpler for developers to retrieve the information they need. They highlight the relevant context and statistical data that help developers anticipate and resolve issues quickly. They are especially beneficial if there is a large amount of code to read.
The entire code should have a suitable number of logs added at all levels.The more logs there are, the more data developers get, and the easier it is to detect errors. However, there should be a balance since excessive logging might overwhelm engineers with irrelevant data. So try to keep track of the smallest portion of the production.
6. Invest in a robust debugging tool
Instead of running a program directly on the processor, debuggers can have a greater degree of control over how it executes by using instruction-set simulators. It enables debuggers to pause or terminate the program in response to particular circumstances. Debuggers display the location of the error in the target application when it crashes.
Tools like Lightrun eliminate the need for troubleshooting, redeploying, or redeveloping the app, resulting in faster debugging. No time is wasted as developers can add logs, analytics, and traces to the app in real-time while it is running. Most importantly, there will be no downtime.
7. Avoid adding extra code
The ideal piece of code to add to a live application is none at all. Adding extra code can have even more significant repercussions than the bug you were trying to resolve in the first place, as you are modifying the app while customers are using it. Therefore, it should be treated as a last resort, and any added code should be carefully considered and strategically written for debugging purposes.
Production debugging doesn’t have to be a pain
It is neither possible nor feasible to deliver a bug-free program to users. However, developers should try to avoid these issues while being ready to handle them if necessary. Lightrun makes production debugging as easy as it can get by enabling you to add logs, metrics, and traces to your app in real-time, with no impact on performance. You can reduce MTTR by 60% and save time debugging to focus on what really matters: your code. Excited to try it out? Request a free demo!