
4 Tools Every Java Programmer Should Know
Java is the most popular programming language. As such, it’s no surprise there are many tools whose primary function is to assist the day-to-day work of Java programmers. In this blog post I will introduce some open-source (and free!) tools and platforms that I’ve used personally for years, and can warmly recommend.
The following tools immensely improve the coding, building, testing and profiling of Java applications, and I think every Java programmer will benefit from a familiarity with them. I built this list based on my experience as a professional Java developer in recent years, and I hope you find them helpful when you code like I did.
Mockito
Mockito is an open-source Java mock library with a simple API and large community support, often regarded as the foremost tool in its space. Mockito helps you create, verify and stub mocks – which are objects that simulate (i.e. mock) complex production objects, without fully creating them in practice.
Therefore, mocks in general (and Mockito specifically) is very useful in the context of unit testing – it allows for proper, isolated, single-unit tests: we can mock the dependencies of each unit and focus on the behavior we want to test.
You have two choices when working with Mockito – you can either use the library’s API methods manually, or you can use the annotations the library provides.
A lot of developers choose to use annotations since they reduce a significant amount of repetitive, boilerplate code you have to write to use the library. The following is a short list of annotations I use the most:
@Spy– Spy the real object. Note that you can use @SpyBean for resolving Spring-specific dependencies.@Mock– Create and inject mocked instances. In Spring, the corresponding annotation is@MockBean.@InjectMocks– Automatically inject instances of your mocks and spies into the annotated class.
You can see more available annotations and usage examples here.
One comment before we go to the next part – note that mocking should not be overused.
A test that includes many mocks – 10 for example – usually indicates that your class has too many dependencies (i.e. it is responsible for too much). In addition, the more mocks you use, the less you’re testing the real environment – so use them wisely!
Sonar
Sonar is the leading automated service for detecting bugs, code smell and security vulnerabilities in your pull requests. By letting Sonar analyze your code, you can identify vulnerabilities and issues before deployment.
Sonar integrates with Github, Bitbucket, Azure and GitLab and fits snugly into most teams’ development processes. That means that every time you open a Pull Request, you can also get a review from Sonar.
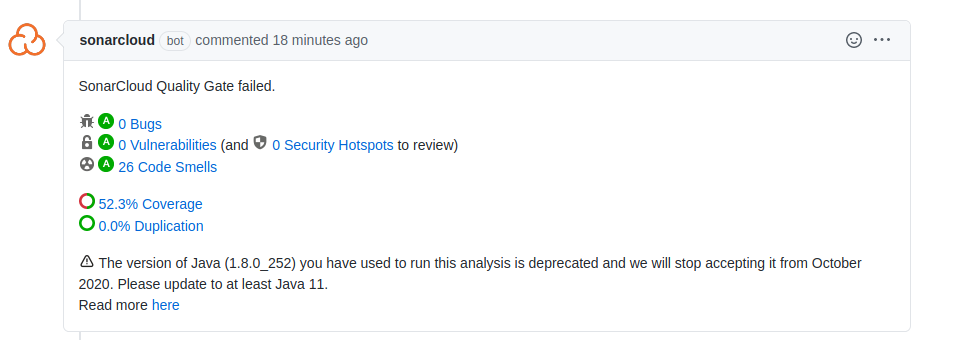
Consider the following example of a sonar report result in a Github PR:
As you can see, Sonar found 26 code smells in this PR’s code and 52.3% coverage. We can drill further down the inspection by clicking on one of the issues, which will redirect us to Sonar for a breakdown of the selected issue.
In Sonar, you can choose between SonarCloud or SonarQube. SonarQube is meant to be integrated with on-premise solutions, like GitHub Enterprise or BitBucket Server, and SonarCloud is for cloud solutions like Github or BitBucketCloud. SonarQube is open-source and free, and Sonarcloud is free for public projects.
I recommend adding a Sonar analysis step every time your code is ready to be merged or released, to ensure maximum code quality. You can also integrate Sonar directly into your favorite CI/CD integration (Jenkins, Azure DevOps, etc.) to have it triggered automatically.
By the way, you can still use Sonar even if you’re not a Java developer. Sonar also supports C#, C/C++, Objective-C, TypeScript, Python, PLSQL and a host of other languages.
IntelliJ IDEA
If you’re a Java developer and you’re one of the 38% who haven’t experienced IntelliJ IDEA – it’s about time you do!
With smart code completion, refactoring and debugging, open-source IntelliJ IDEA leads developers to efficient and convenient coding. It is your armchair assistant, there to aid and redirect you to the correct path at every step of the way.
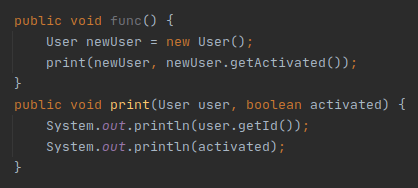
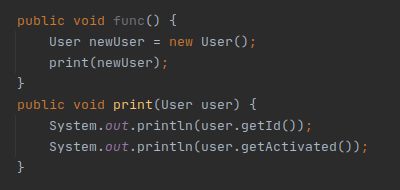
Compared to other Java IDEs, IntelliJ IDEA’s strength is its intelligence. IntelliJ IDEA understands what you want to do and does it. For example, let’s say there is a method that accepts User and a property of User, and you want to simplify it by simply sending User.
With the inline shortcut (CTRL+ALT+N) on the “activated” parameter, IntelliJ IDEA understands you want to use user.getActivated() and removes the parameter from the method and its usages! No manual changes are needed. The result:
For more refactoring tips with IntelliJ IDEA, take a look at the refactoring guide right here, or learn some new debugging tricks with IntelliJ IDEA.
And a quick plug – if you’re already an IntelliJ IDEA user (or a soon-to-be-convert!), we offer a plugin for real-time production debugging, right from inside your IDE. Schedule a demo!
VisualVM
VisualVM is a powerful open-source profiling tool for Java applications. It supports local and remote profiling, memory and CPU profiling, thread monitoring, thread dumps and heap dumps. VisualVM displays a monitoring and performance analysis of your app, so you can fix your code prior to real-time crashes.
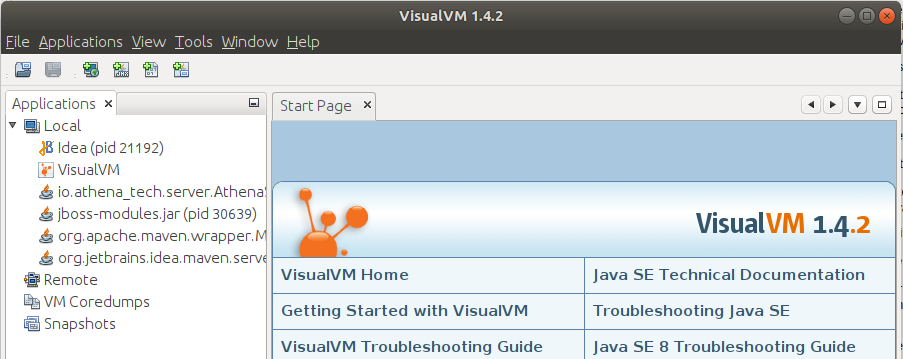
VisualVM displays the running Java applications on the left pane:
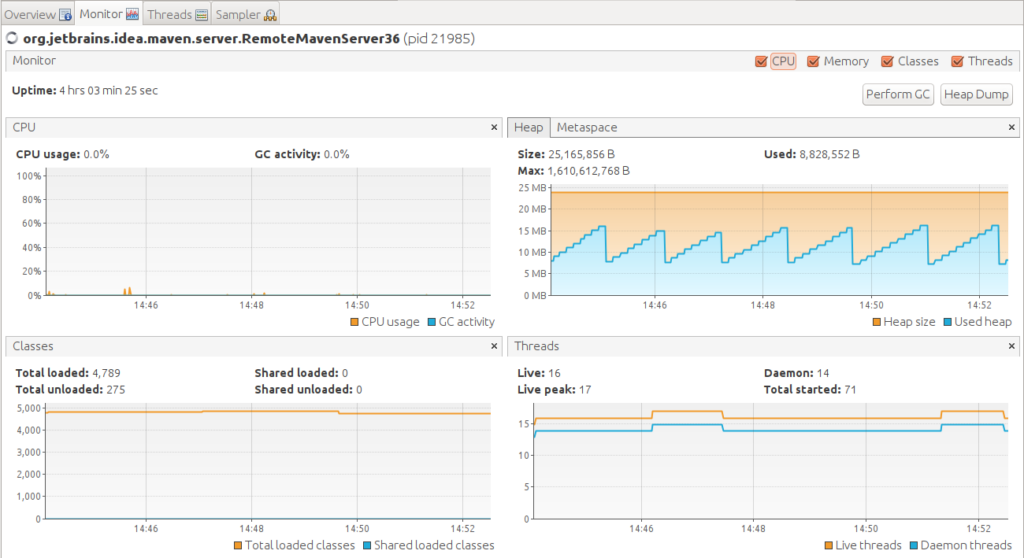
After selecting a Java application, we can see CPU usage, heap space, classes and threads in the monitor tab:
This enables you to understand, for example, if your application takes too much CPU or memory. Moreover, you can detect memory leaks using a heap dump – a snapshot of the current Java objects and classes in the heap. See all the possible options and some usage examples here.
In Summary
There are many Java tools and platforms available that can help you code faster and smarter, by streamlining various coding-adjacent activities – like testing, analyzing, profiling, building and releasing.
These tools will make your coding more productive and efficient, and reduce many of the mundane activities we deal with when we program. There are also many Java communities that can provide assistance and consultation. Let me know in the comments section if you have any other favorite tools you like to use, and I’ll try to incorporate them into the next article!
It’s Really not that Complicated.
You can actually understand what’s going on inside your live applications.

