8 Debugging Tips for IntelliJ IDEA Users You Never Knew Existed
Jun 14, 2020


As developers, we’re all familiar with debuggers. We use debugging tools on a daily basis – they’re an essential part of programming. But let’s be honest. Usually, we only use the breakpoint option. If we’re feeling frisky, we might use a conditional breakpoint.
But guess what, the IntelliJ IDEA debugger has many powerful and cutting-edge features that are useful for debugging more easily and efficiently. To help, we’ve compiled a list of tips and tricks from our very own developers here at Lightrun. We hope these tips will help you find and resolve bugs faster.
Let’s get started.
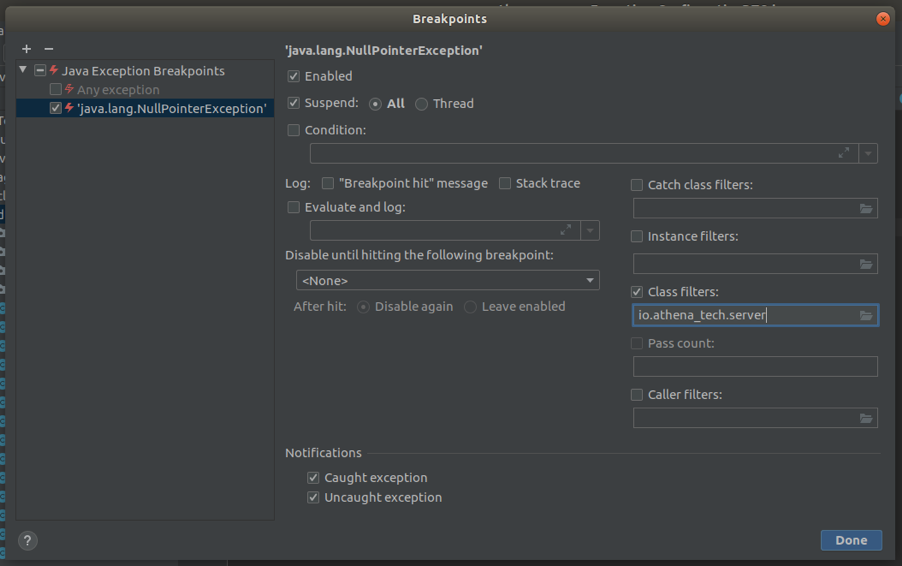
1. Use an Exception Breakpoint
Breakpoints are places in the code that stop the program, to enable debugging. They allow inspecting the code behavior and its functions to try to identify the error. IntelliJ offers a wide variety of breakpoints, including line breakpoints, method breakpoints and exception breakpoints.
We recommend using the exception breakpoint. This breakpoint type suspends the program according to an exception type, and not at a pre-defined place. We especially recommend the IntelliJ Exception breakpoint because you can also filter the class or package the exceptions are a part of.
So you can define a breakpoint that will stop on a line that throws NullPointerException and ignore the exceptions that are thrown from files that belong to other libraries. All you have to do is define the package that has your project’s files. This will help you focus the analysis of your code behavior.
Lightrun offers snapshots – breakpoints that do not stop the program from running.
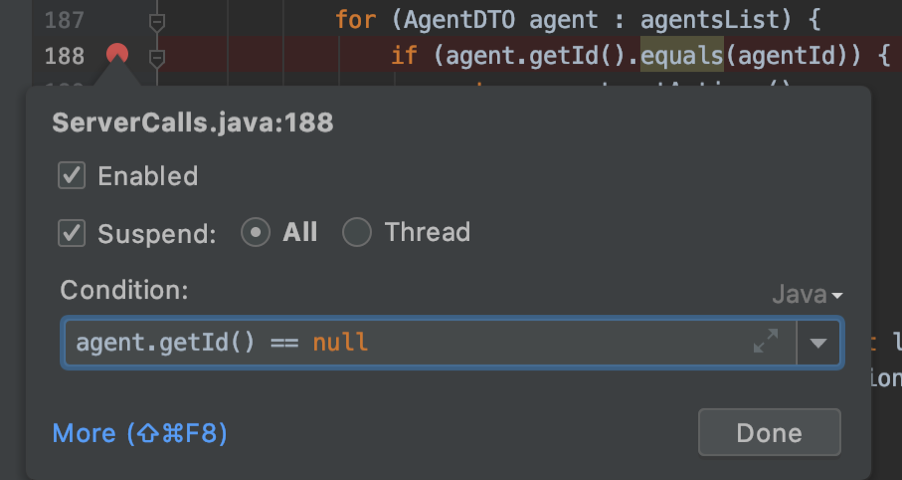
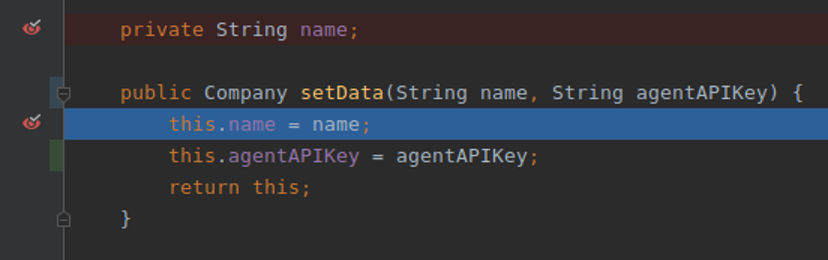
2. Use Conditions in Your Breakpoints
This is one of the most under-utilised tools in debuggers and possibly one of the most effective ones. Use conditions to narrow down issues far more easily, to save time and the work of hunting for issues. For example, in a loop you can define a breakpoint that will only stop on the actual bug, relieving you from manually going over loops until you run into an issue!
In the loop below, you can see the breakpoint will stop the service when the agent id value is null. So instead of throwing a null pointer exception we’ll be able to inspect the current state of the VM (virtual machine) before it does.
Notice that a condition can be very elaborate and even invoke methods as part of the condition.
Lightrun offers conditions for all its actions: snapshots, logs etc.
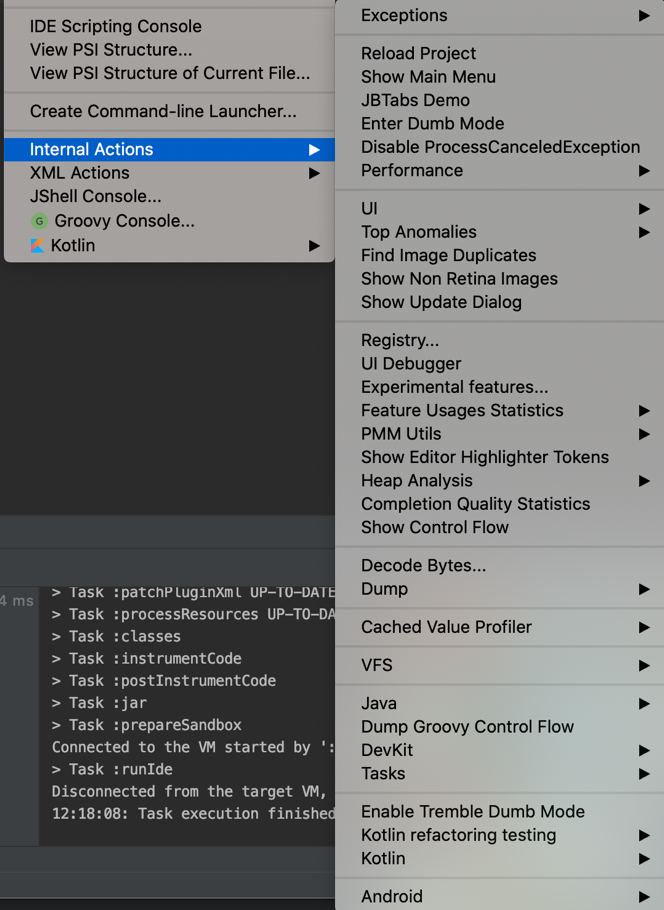
3. Enable the “Internal Actions” Menu for Custom Plugin Development
If you’re writing a custom IntelliJ/IDEA plugin, enable Internal Actions (Tools -> Internal Actions) for easy debugging. This feature includes a lot of convenient options, like a component inspector and a UI debugger. It’s always handy to have a wide set of tools at your disposal, providing you with options you may have never thought of yourself.
To enable Internal Actions select Help -> Edit Custom Properties. Then type in
idea.is.internal=trueand save. Upon restart you should see the new option under the Tools menu.
4. Use the “Analyze Thread Dump” Feature
A thread dump is a snapshot that shows what each thread is doing at a specific time. Thread dumps are used to diagnose system and performance issues. Analyzing thread dumps will enable you to identify deadlocks or contention issues.
We recommend using IntelliJ’s “Analyze Thread Dump” feature because of its convenient browsing capabilities that make the dump easy to analyze. “Analyze Thread Dump” automatically detects a stack trace in the clipboard and instantly places it with links to your source code. This capability is very useful when traversing stack dumps from server logs, because you can instantly jump to the relevant files like you can with a local stack trace.
To access the feature go to the Analyze menu. The IDE supports activating this feature dynamically when the IDE detects a stack trace in the clipboard.
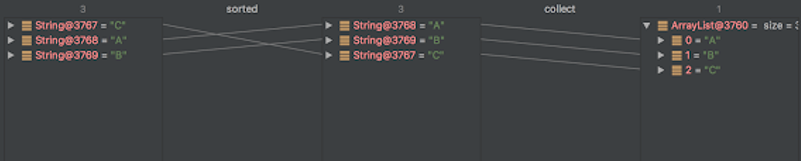
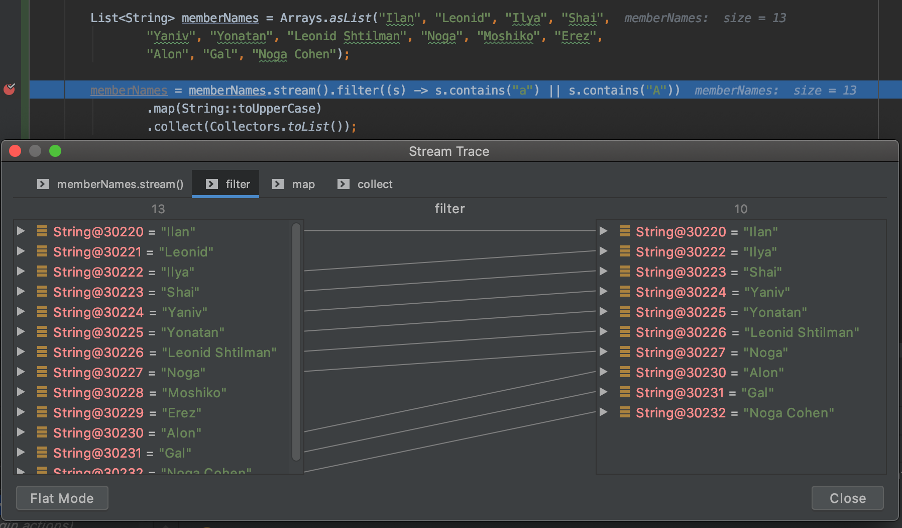
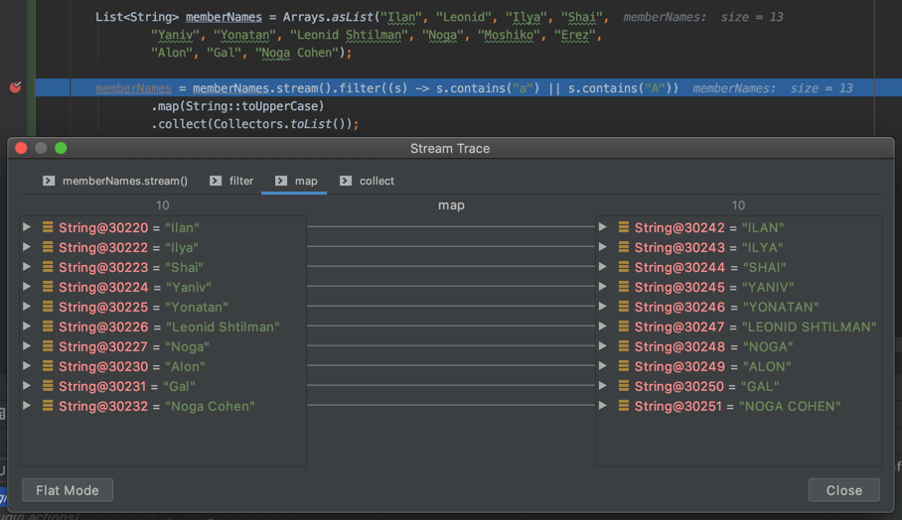
5. Use the Stream Debugger
Java 8 streams are very cool to use but notoriously hard to debug. Streams condense multiple functions into a single statement, so simply stepping over the statements with a debugger is impractical. Instead, you need a tool that can help you analyze what’s going on inside the stream.
IntelliJ has a brand new cool tool, the stream debugger. You can use it to inspect the results of the stream operation visually. When you hit a breakpoint on a stream, press the stream debugger icon in the debugger. You will see the UI mapping of the value of the stream elements at each stage/function of the stream. Thus, each step is visualized and you can see the operations in the stream and detect the problem.
6. Use Field Watchpoints
The Field Watchpoint is a type of breakpoint that suspends the program when the defined field is accessed or modified. This can be very helpful when you investigate and find out that a field has a wrong value and you don’t know why. Watching this field could help finding the fault origin.
To set this breakpoint, simply add it at the line of the desired field. The program will suspend when, for example, the field is modified:
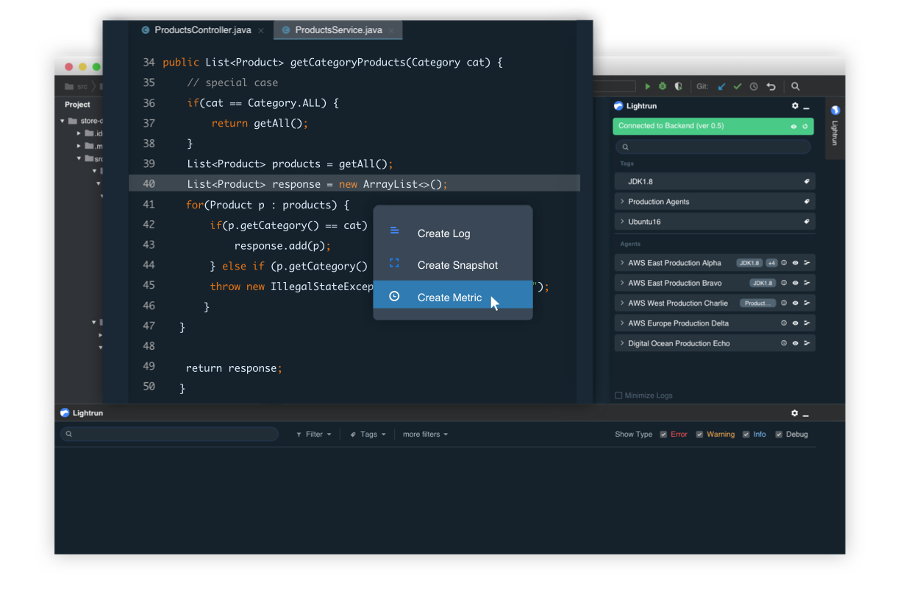
7. Debug Microservices with the Lightrun Plugin
Lightrun’s IntelliJ plugin enables adding logs, snapshots and performance metrics, even while the service is running. Meaning, you can add instrumentation to the production and staging environments. You can debug monolith microservices, Kubernetes, K8, Docker Swarm, ECS, Big Data workers, serverless, and more. Multi-instance support is available through a tagging mechanism.
The Lightrun plugin is useful for saving time, so instead of going through multiple iterations of local reproduction of environments, restarts and redeployments you can debug straight in production.
Want to learn more? Request a demo.
8. Use a Friend – Real or Imaginary
When it comes to brainstorming, 1+1=3. And when it comes to dealing with complex debugging issues, you are going to need all the brainpower you can get. Working with someone provides a fresh set of eyes that views the problem in a different manner and might identify details you missed. Or you both complement each other until you reach the solution. Just by asking each other questions and undermining some of each other’s assumptions, you will reach new conclusions that will help you find the problem. You can also use each other for “Rubber Duck Debugging”, or as we like to call it, “Cheetah debugging”.

We hope these tips by our own developers will help you with your debugging needs. Feel free to share your debugging tips and best practices with us and to share this blog post to help others.
As we mentioned in tip no. 7, Lightrun’s IntelliJ plugin enables developers to debug live microservices without interrupting them. You can securely add logs and performance metrics to production and staging in real-time, on-demand. Start using Lightrun today, or request a demo to learn more.