Developer Observability Platform
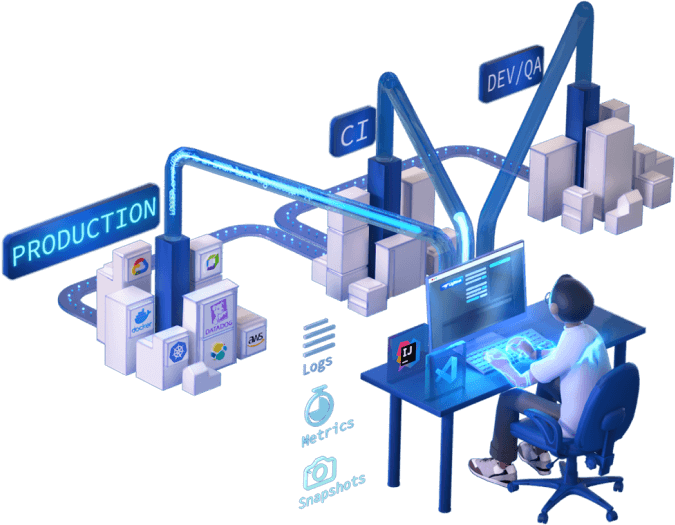
Dynamically instrument logs, traces, and metrics to get real-time insights into the behavior of your live applications at runtime straight from your IDE. No code changes, redeployments, or restarts are needed.
Lightrun is trusted and loved by developers globally


Developers Use Lightrun
For
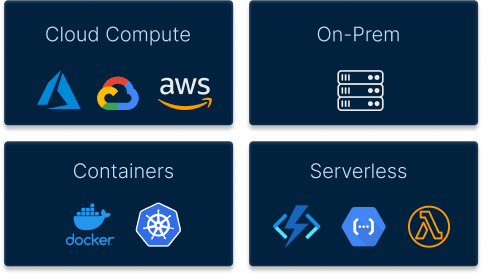
Lightrun works in the cloud, on-premise and everywhere in between. We run where you run.
Lightrun is trusted and loved by developers globally
Developers & Engineering Leaders Choose Lightrun To
by 60%
to Market
Lightrun is trusted and loved by developers globally
Missing visibility at runtime?
code, stage, commit, push, open PR, build, test,
wait for approval,deploy, invoke, open dashboard, filter,
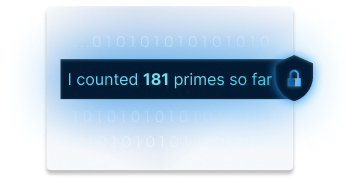
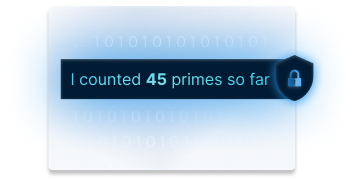
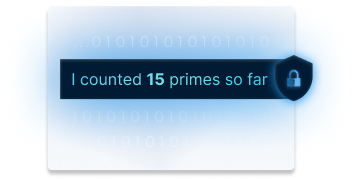
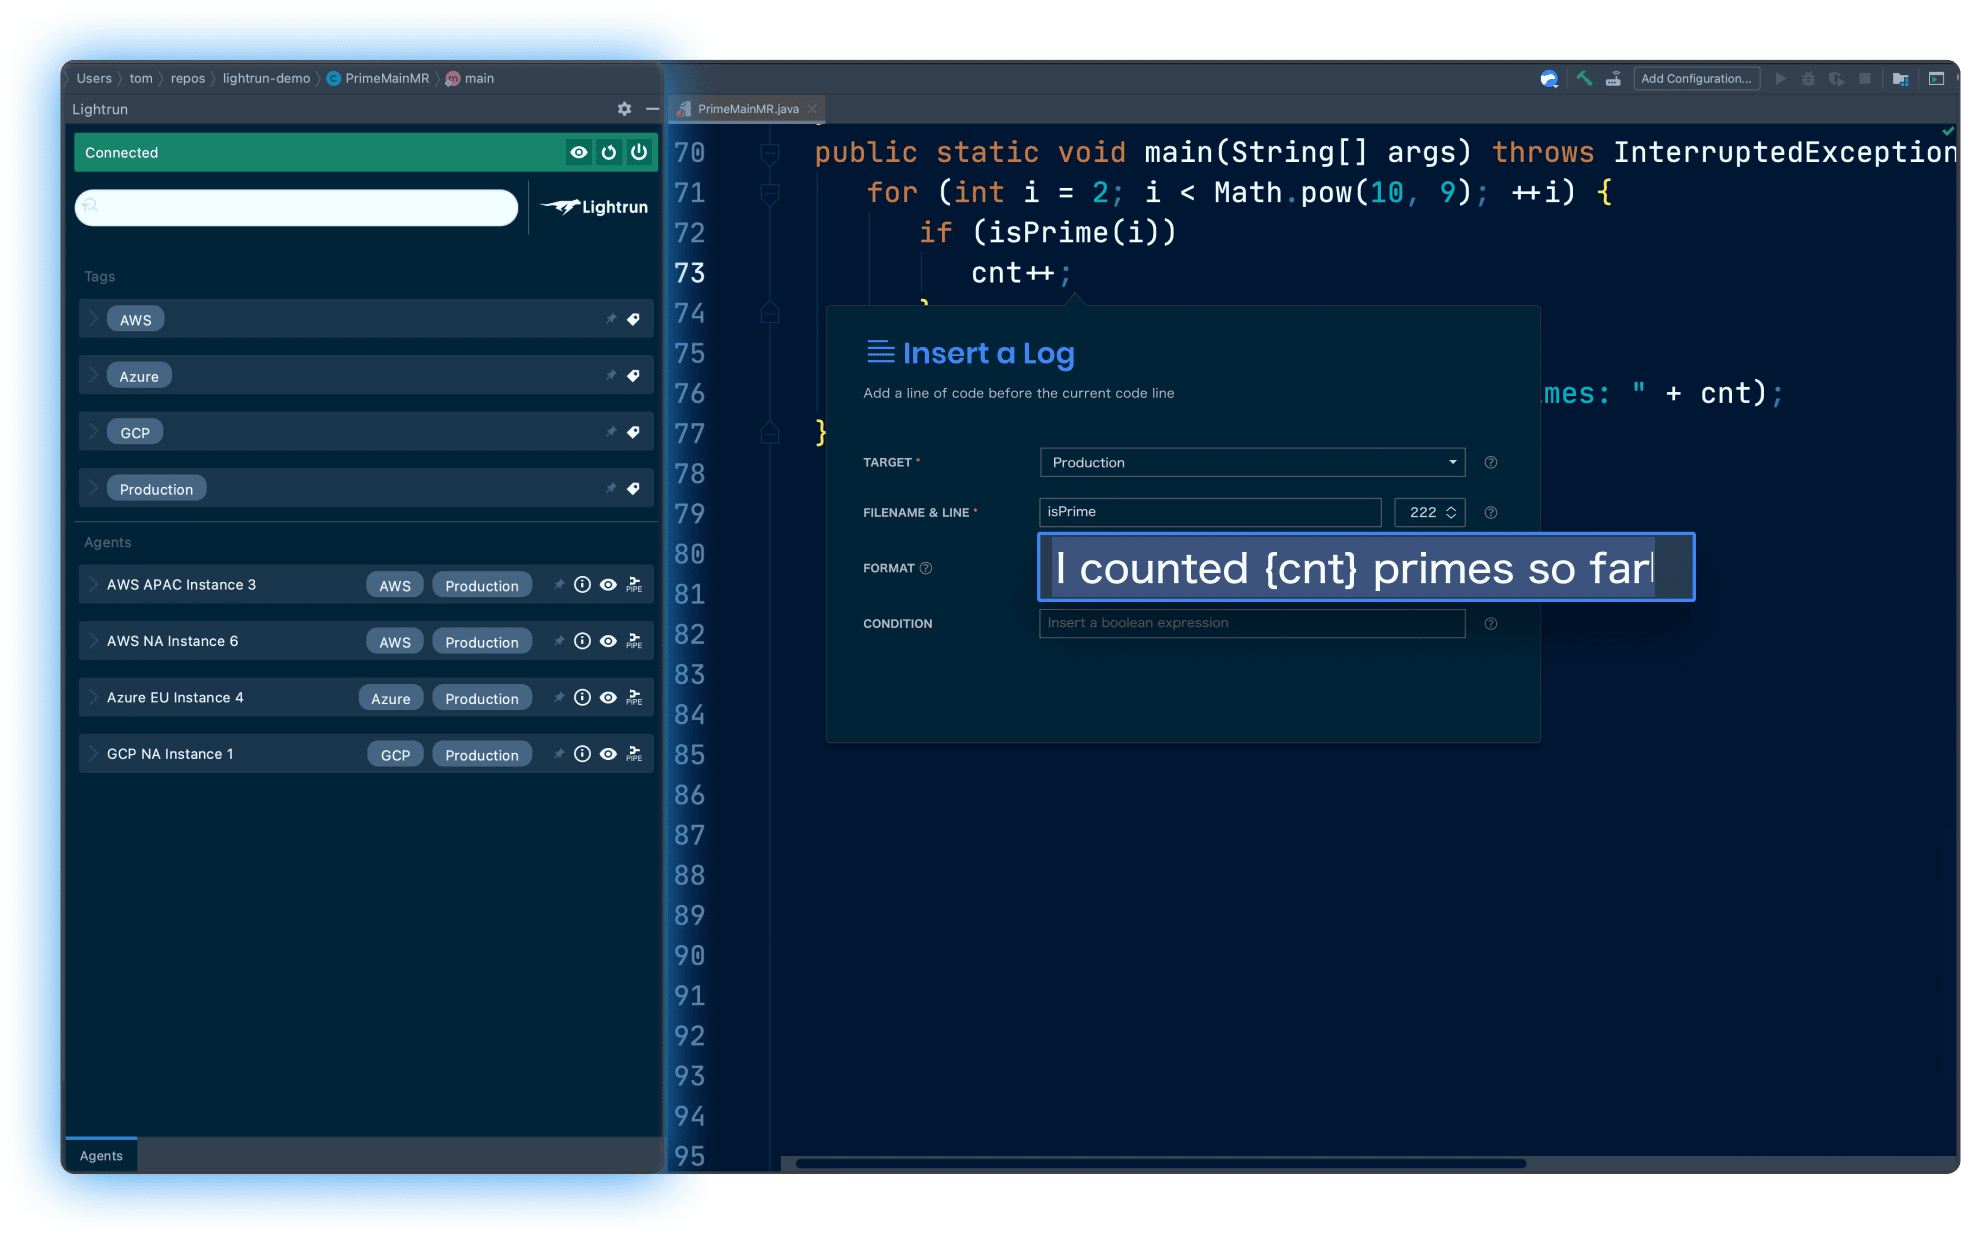
Dynamically Instrument, Observe.


How Lightrun Works
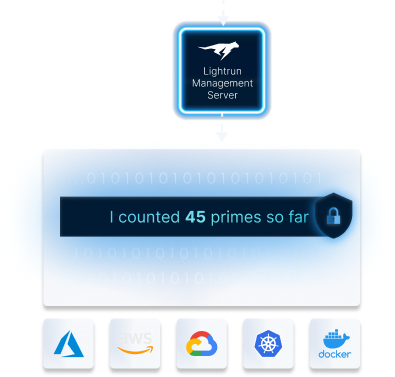
Securely inject logs, metrics and traces in real time while the process is running. Debug monoliths, microservices, K8s, CI, serverless, and more from your IDE.
-
Lightrun requires no source
code access -
No code, only metadata,
passes through the server -
Lightrun is runtime-based, and runs
where you run at any scale
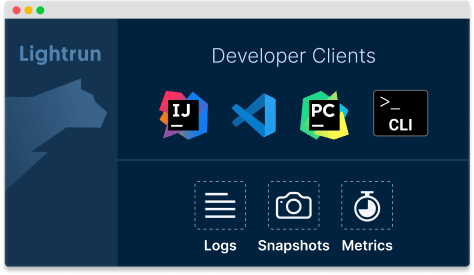
Choose your IDE
No code, only metadata, passes through the server.
-

VSCode -

JetBrains
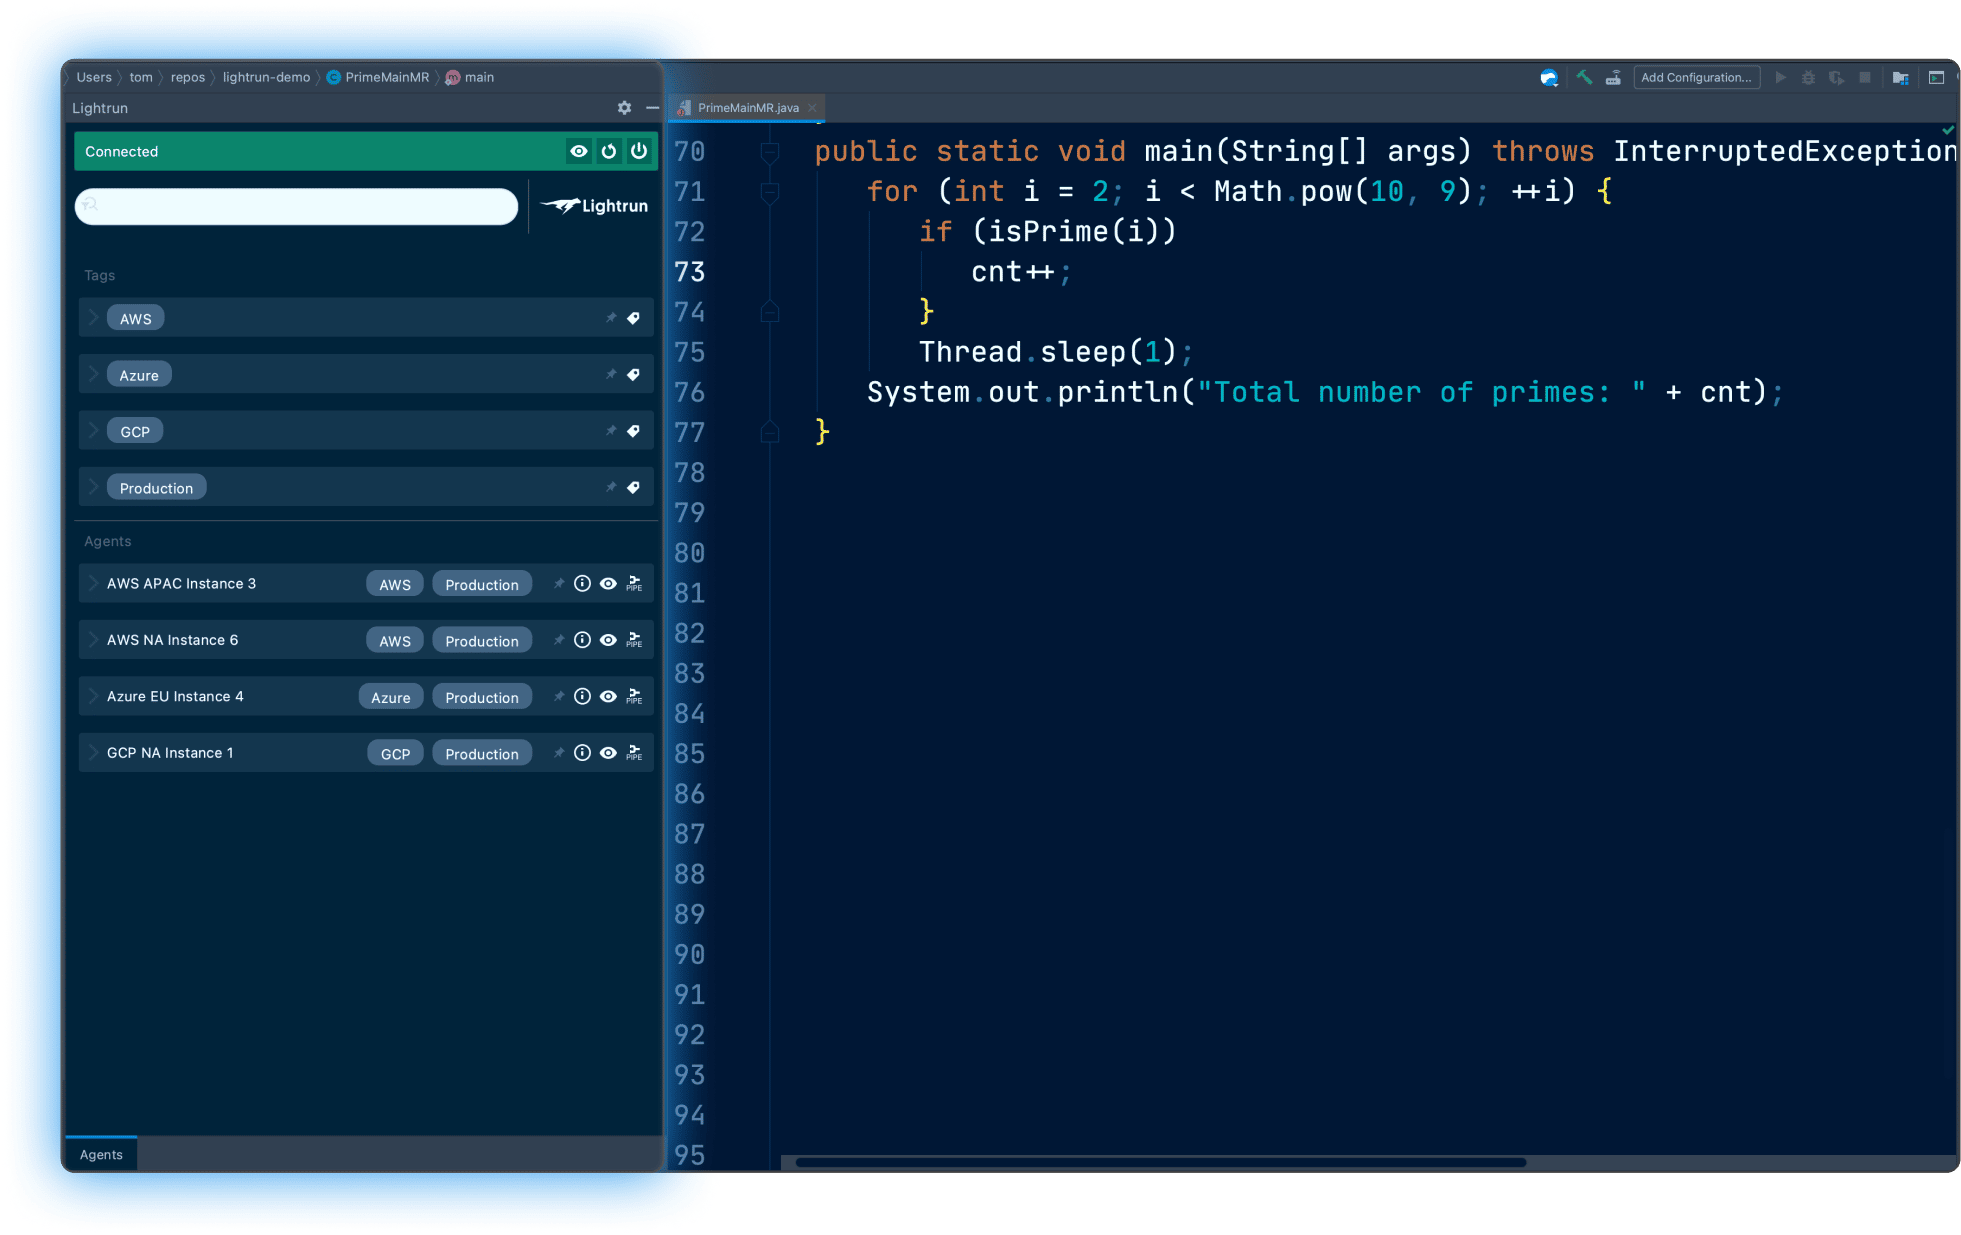
Choose where you need more visibility: your code, legacy code, 3rd party code – you name it, we instrument it.
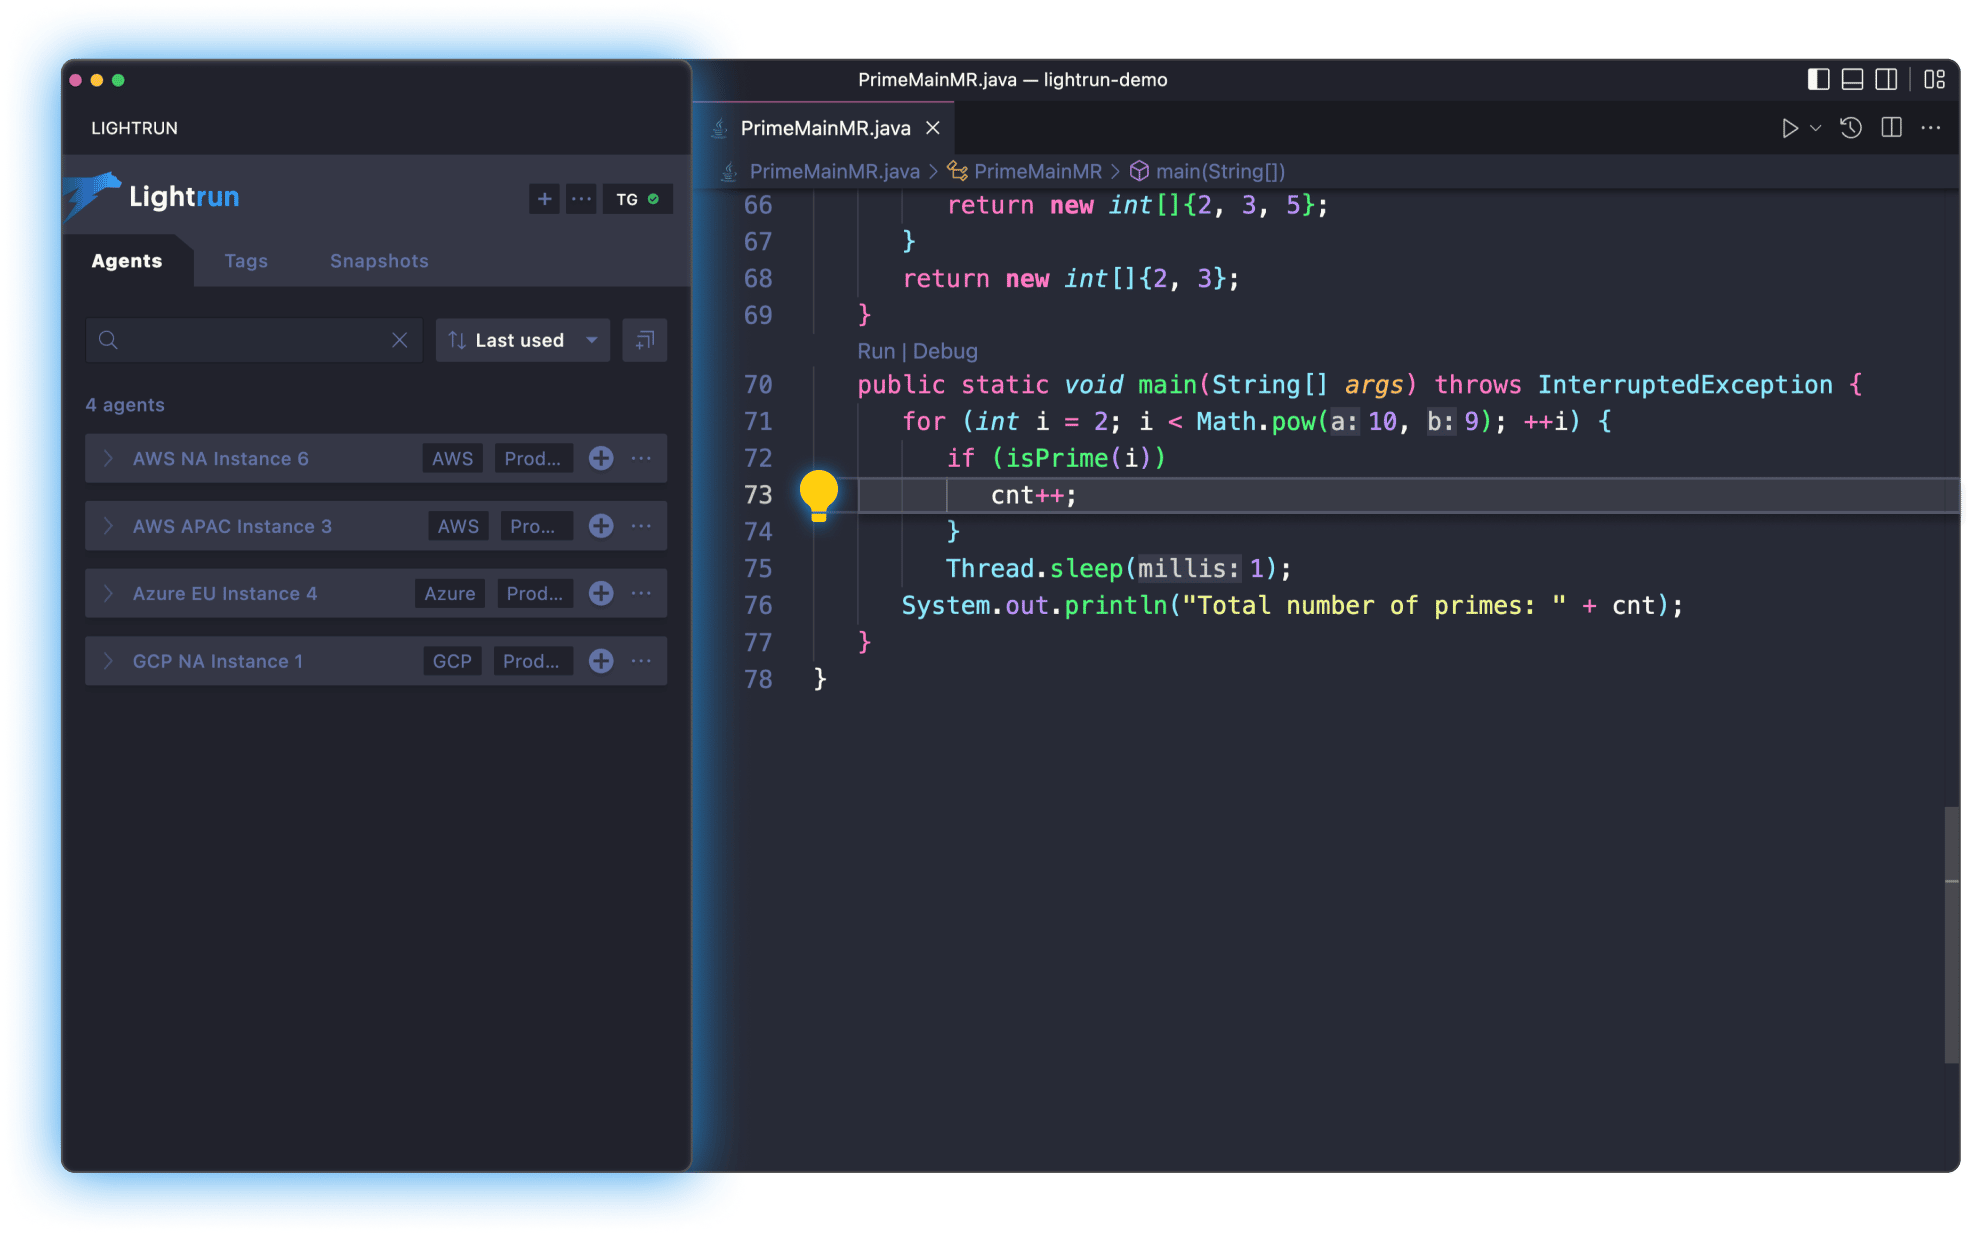
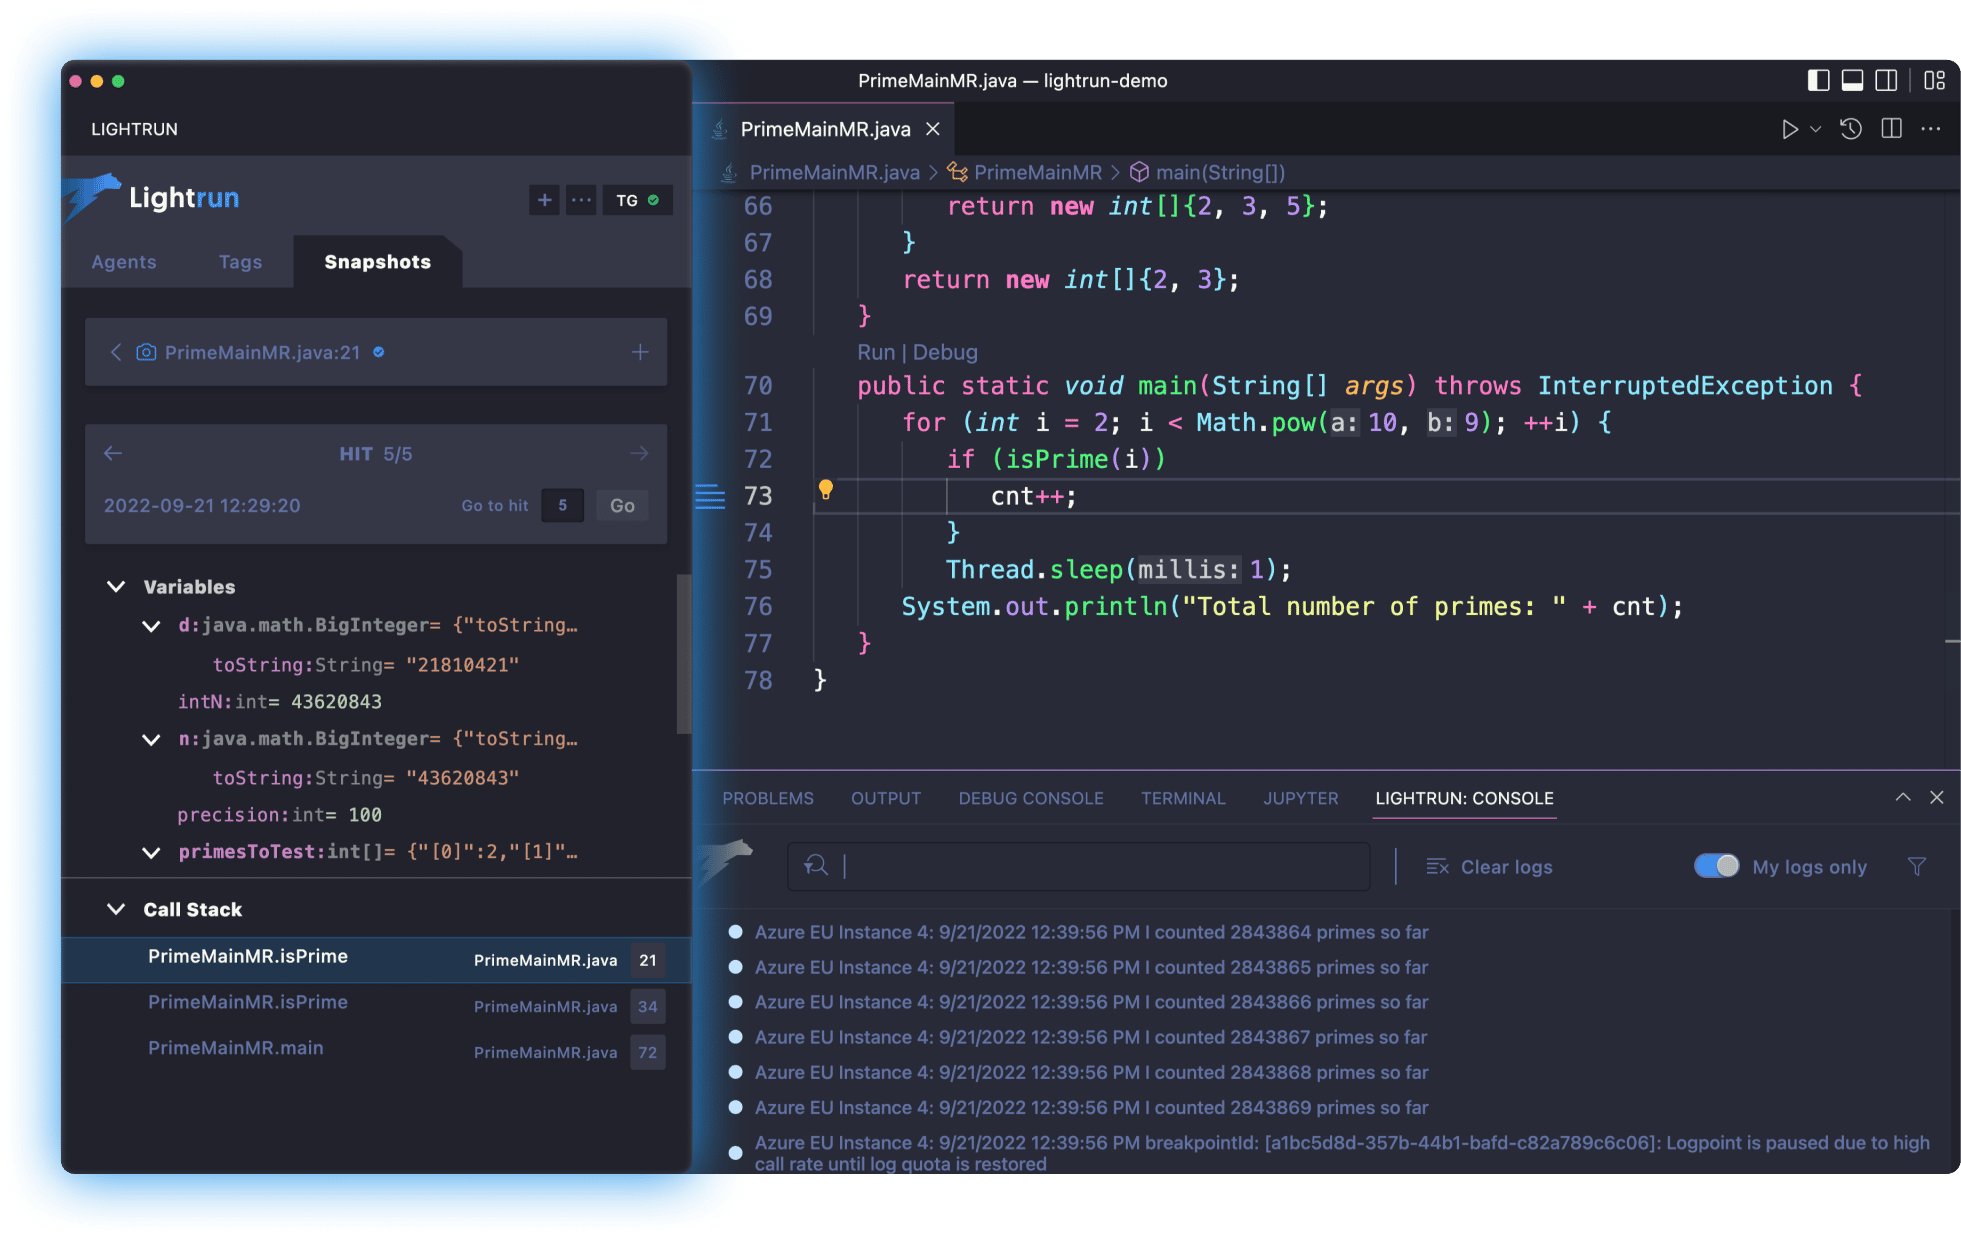
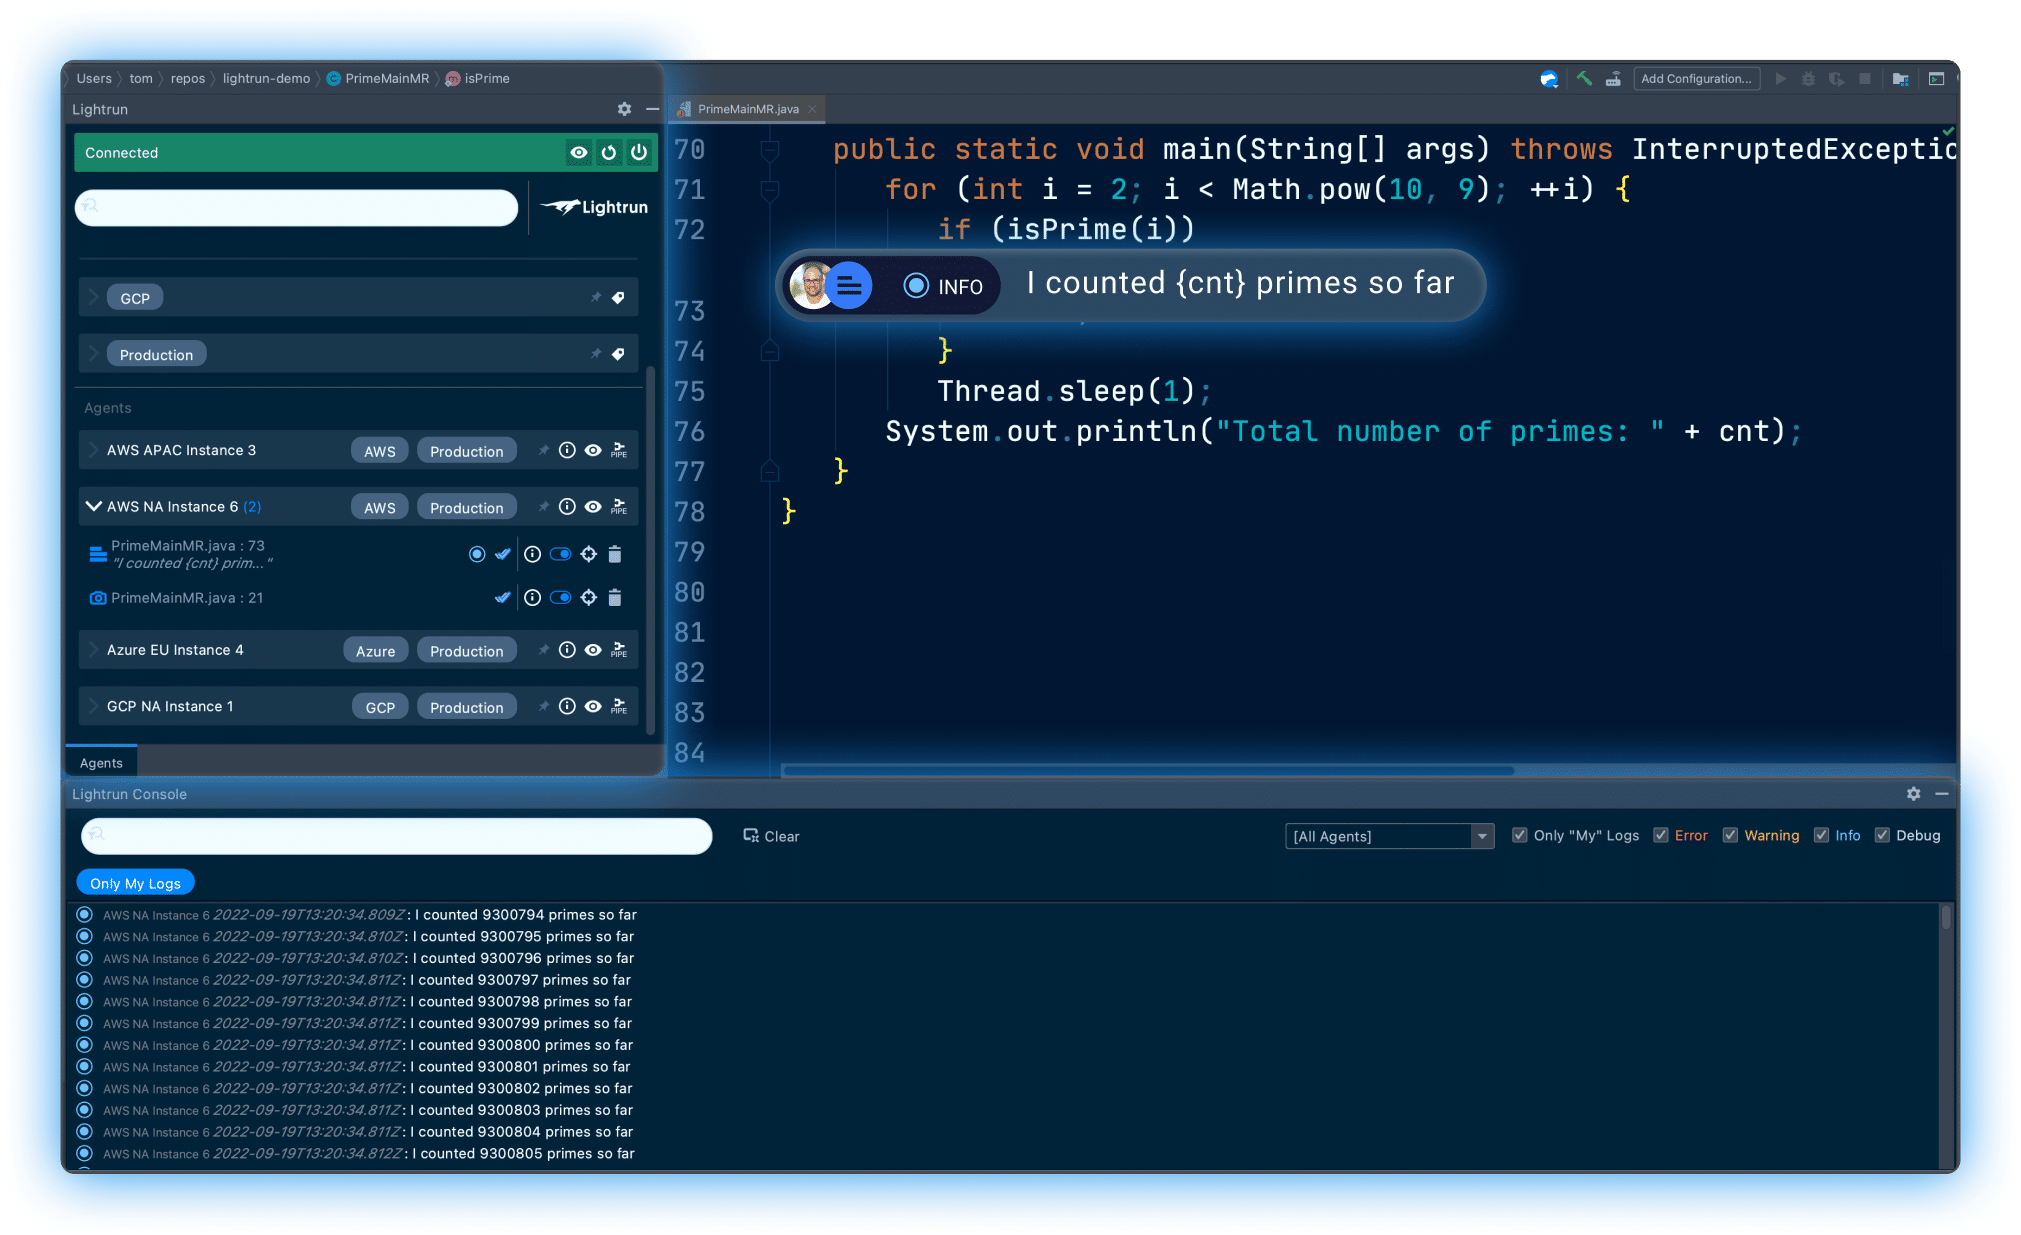
Instrument everything in real-time, without stopping the live application: one click in the IDE, and your live app is instrumented in a read-only, secure fashion.
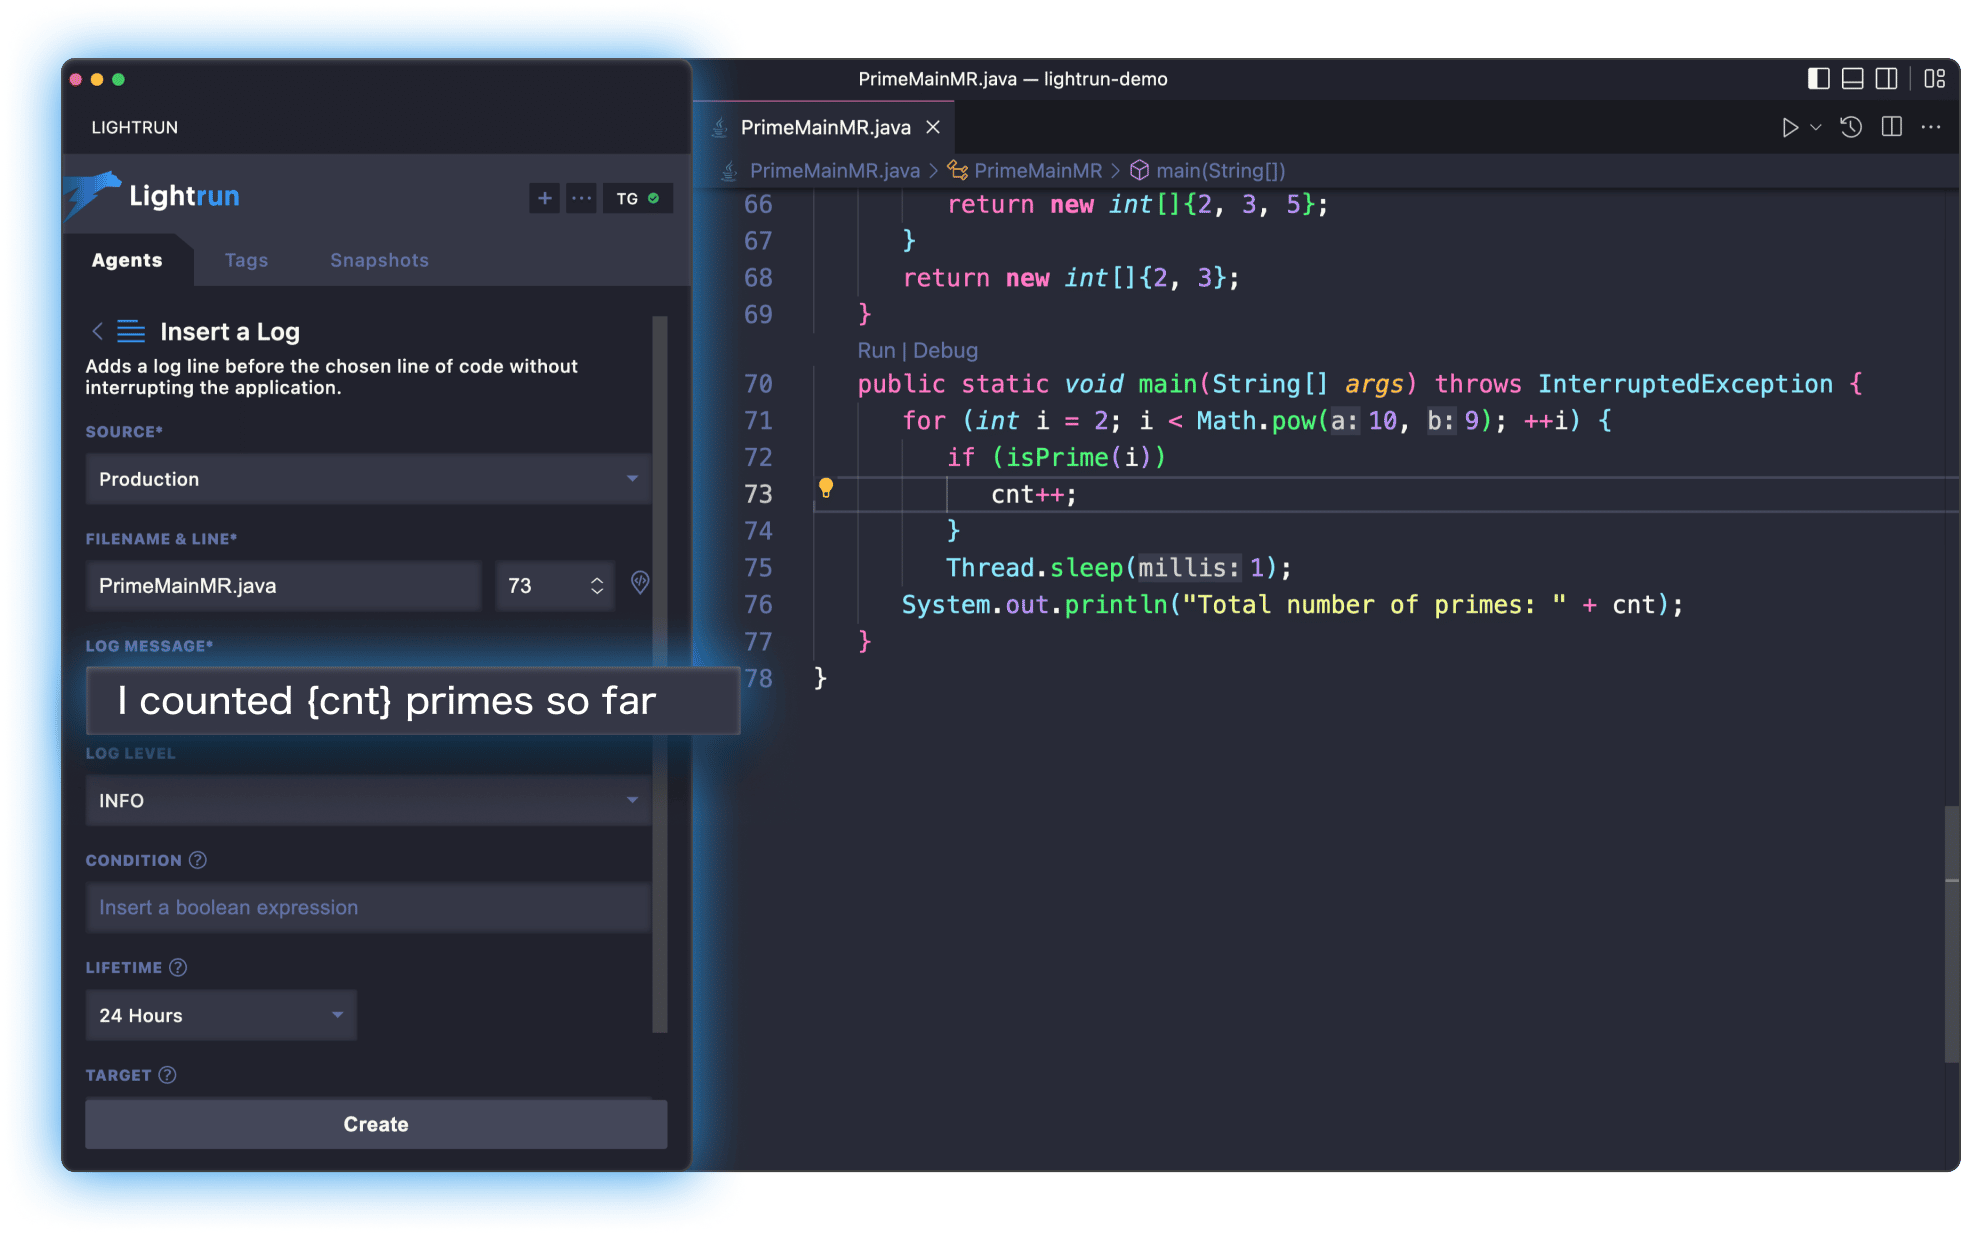
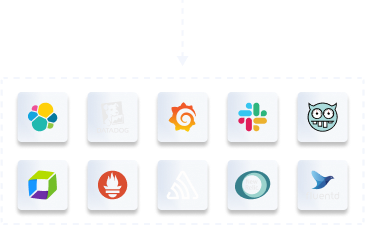
Observe the information immediately: see it right in the IDE or in one of our 30+ observability integrations.


Choose where you need more visibility: your code, legacy code, 3rd party code – you name it, we instrument it.
Instrument everything in real-time, without stopping the live application: one click in the IDE, and your live app is instrumented in a read-only, secure fashion.
Observe the information immediately: see it right in the IDE or in one of our 30+ observability integrations.
Use Cases
Live debugging in production
Capture context in real-time, without stopping execution, with visibility down to the single line.
Troubleshoot cloud-native applications
Get visibility across replicas, regions, or entire clouds.
Understand codeflow and code behavior in production
Enlighten the code path your users take through the app.
Validate progressive delivery / feature flags
Traverse complex, conditional paths to understand what really happened.
Troubleshoot serverless applications
Break apart issues in function-based workloads, one lambda at a time.

Reduce logging costs
Get deep context within your data to figure out logic and quality issues.
Performance analysis and investigation
Break apart performance bottlenecks on the application level.
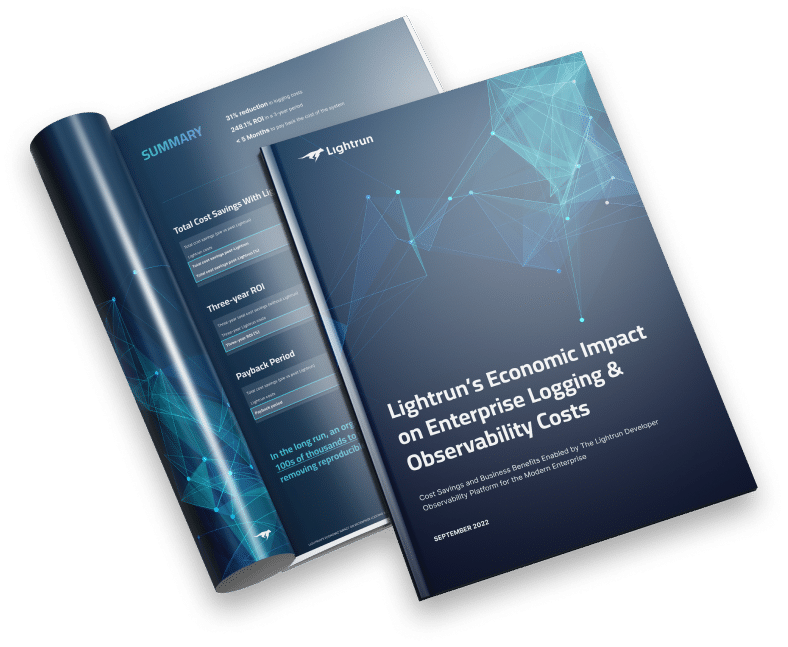
Lightrun’s platform delivers 763% ROI and $5.62M NPV over a three-year period. Read Lightrun’s economic impact study below!
Get our deep research into the economic impact of using a developer observability platform in major engineering organisations, in which you will learn how Lightrun has:
- Saved $3.87M via developer productivity improvements
- Increased revenue by $1.64M due to lower MTTR
- Delivered 763.9% 3-year ROI after < 7 months
Lightrun Accelerates Development For...
Developers & Team Leads
- Increase developer productivity by up to 20%
- Reduce time to market
- Easy troubleshooting of issues at runtime
- Native developer experience, right from your IDE
Engineering Executives
- Optimize cloud logging costs by up to 31%
- Continuous quality improvement
- Faster release velocity
- Reduce MTTR by up to 35%
- Reduce developer onboarding time
DevOps Engineers & SREs
- Improve visibility into application logic
- Reduce MTTR by up to 35%
- Easier collaboration with engineering teams
- Faster code-level RCA
Security & Privacy
Lightrun assures companies the security and privacy of their code by being ISO-27001, SOC 2, GDPR and HIPAA-compliant. In addition, Lightrun provides enterprise-grade controls out of the box: encryption, authentication, RBAC, SSO, audit trail, and privacy blocklisting.


300+ Supported Seamless Integrations
Lightrun supports your favorite languages and seamlessly integrates into your existing IDEs, tools, pipelines, workflows and cloud platforms.
The World’s Most Cutting Edge Companies Use Lightrun

![]()
“Lightrun was a real life changer for us”
Learn how Taboola slashed MTTR and saved over 260 debugging hours a month with Lightrun.

“Lightrun’s platform resulted in a 70% reduction in MTTR (Mean Time To Resolve) for my teams, as well as increased productivity due to easier access to highly granular runtime data. In addition, the experience of production troubleshooting has changed dramatically – my engineers do not fear it anymore; it’s just another workday – and troubleshooting sessions that used to span days now take mere minutes.”
Lee Ditiangkin
Product Manager at IBM


“Leveraging Lightrun, our teams unraveled complex incidents that were challenging to solve and replicate locally using conventional debugging solutions. Lightrun enables us to quickly introduce dynamic logs and snapshots surrounding the incident area and by that reducing MTTR from hours to minutes.”
Jacob Eckel
VP, R&D, Gong

“Lightrun has been a game-changer for us. With Lightrun we shortened our development process significantly by skipping iterative deployment cycles when adding logs and metrics. A day’s work turned into just one hour. Lightrun provided us with new observability into our production environment that was not accessible to us beforehand. Lightrun is a key component in our developer toolset here at Taboola and one of our development best practices.”
Rami Stern
R&D Infrastructure Team Leader at Taboola

“Drata’s main focus is to ensure we’re delivering value for our customers and addressing their most urgent needs; we embrace that approach across the entire organization. Leveraging Lightrun to significantly streamline logging has allowed us to remediate faster without shifting our focus away from critical business initiatives.”
Dave Knell
VP Software Engineering at Drata
“By using Lightrun, our development team was able to figure out an extremely complex incident that was hard to parse and reproduce locally and with the standard debugging solutions. The team was able to use Lightrun to quickly add logs and snapshots around the area of the incident, reproduce and fix it.”
Yan Dyshkalps
Director of Technology Research, Architecture and Infrastructure, InsideTracker


“Using Lightrun to debug an actual issue in production enabled us to react instantly. We were able to add the right logs and identify the root-cause in a real-time session, instead of waiting for redeployments.”
Tom Shapira
Director of Software Engineering at WhiteSource

“Lightrun is a strategic tool in our SRE & incident mgmt. playbook, and increases the organization’s capacity to respond to customer-facing applicative issues quickly. Lightrun empowers our developers with safe, real-time troubleshooting capabilities and has enabled them to debug mission-critical, complex applicative issues 50-60% faster.“
Director of Engineering
F10 Company, >10K Developers
Resources Highlights
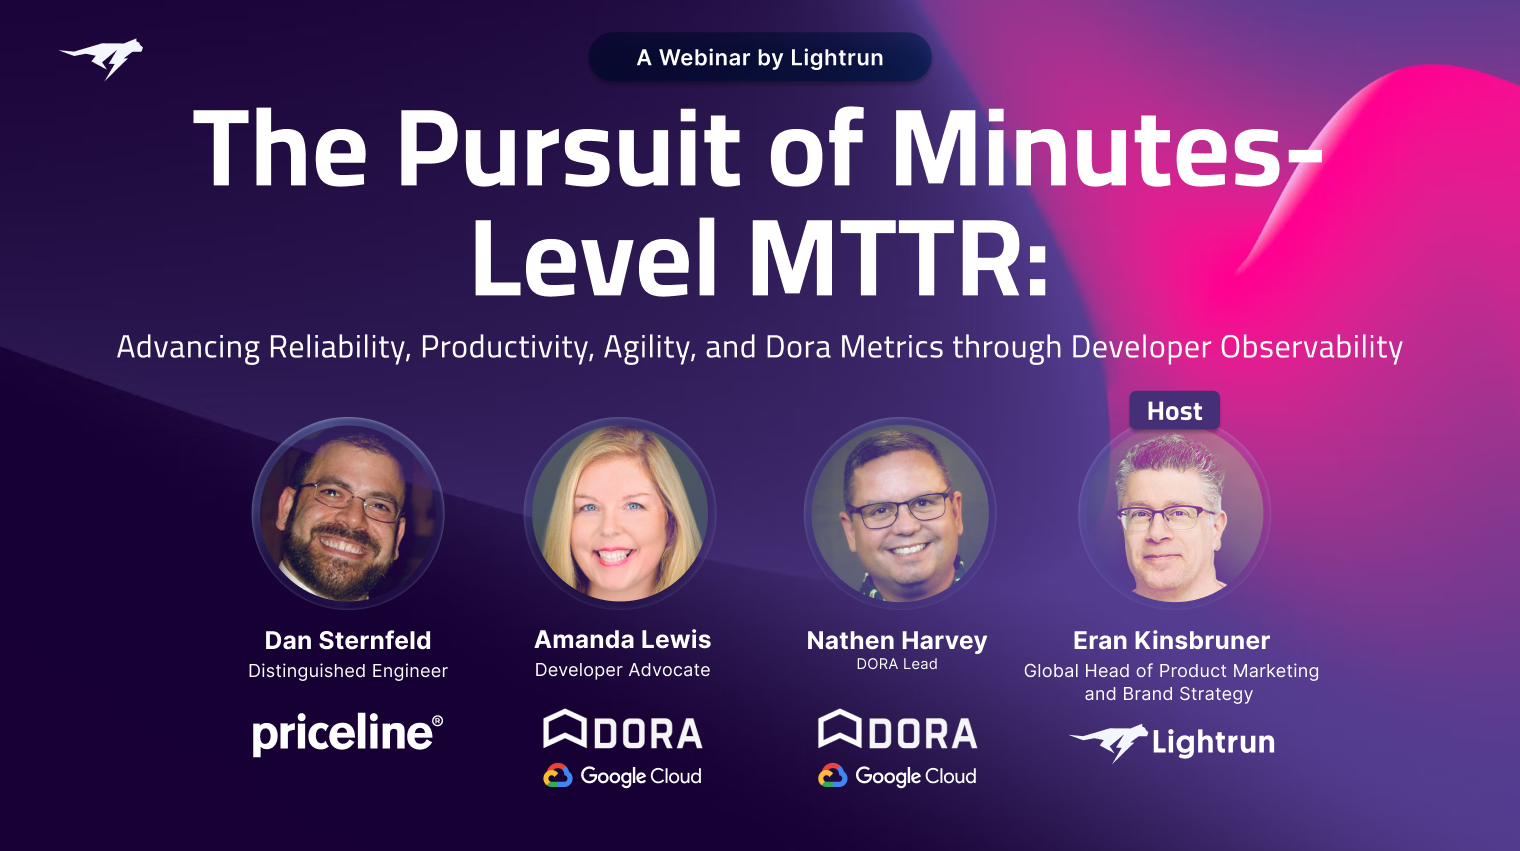
Pursuing Minutes-Level MTTR with Developer Observability
Among the many topics that will be discussed in this webinar will be:
√ Specific challenges faced by Priceline in software development and troubleshooting, shedding light on the unique aspects of Travel and E-commerce app debugging of P1 issues and developer productivity challenges.
√ How can a developer observability platform enhance the overall DORA metrics and improve observability maturity?
√ The rise of platform engineering and how it relates to DevOps, developer productivity, observability, and the DORA metrics?
√ How can teams better understand and prioritize metrics and tools for improved software development?
√ What’s next for developer productivity with the growing adoption of GenAI?
√ Nathen and Amanda will provide a glimpse into the future, sharing insights on where DORA is heading.
The webinar promises a rich exchange of ideas and experiences, offering attendees valuable takeaways for enhancing their software development practices. Don’t miss this opportunity to stay ahead in the dynamic world of software development.
How Gong Enabled Secure Production Debugging Across their Entire Engineering Organization with Lightrun
Using Lightrun, The entire engineering team at Gong, consisting of a few hundred, transformed their troubleshooting procedures to incorporate dynamic logs and snapshots on-demand within their debugging workflows, reducing their MTTR significantly
Ensuring Reachability and Remediating Vulnerabilities at Runtime 5X Faster with Lightrun
Learn how using Lightrun dynamic observability can help reduce SCA reported CVEs significantly while allowing developers to only focus on reachable security vulnerabilities.
Key Benefits of Pairing Generative AI Tools with Developer Observability
Learn how using Lightrun developer observability developers can shift-left observability and quickly debug and solve complex issues in code that was generated by Gen-AI tools.
What the industry is saying about us
Having a nonintrusive way to add logs and metrics while the service is running in production gives engineers faster access and insight to production issues, and helps enhance their diagnosis and root cause analysis capabilities.
Hassan Ennaciri, Senior Director, Gartner
Lightrun sets itself apart in the effort to bring observability into a routine and day to day task for developers is by bringing capabilities into their tools and day to day workflow.
Liam Rogers, Research Analyst, 451 Research
Unlike the traditional APM go to market, Lightrun focuses on real time fixes by developers. Rather than collecting all system logs, or a subset of them, Lightrun is designed to improve the logs in flight.
James Governor Co-founder, RedMonk
Seeing this type of information [logs and metrics] from production in your IDE is the final frontier of shifting left
Kief Morris, Principal Cloud Technologist, Thoughtworks
FAQs
Most common questions
Do you charge per developer seat or per SDK?
Lightrun charges per SDK – concurrently running SDKs, which directly translate into running application instances (running JVMs, V8s, Python interpreters, etc…).
What languages does Lightrun support?
Lightrun supports all JVM languages – Java, Scala & Kotlin, as well as Node.js (including TypeScript), Python (both 2 & 3) and .NET (C# and F#). We’ll be releasing support for more languages soon – stay tuned!
Does Lightrun work on-prem?
Lightrun can be deployed completely on-prem, without relying on any Lightrun-hosted infrastructure. In addition, Lightrun can be deployed to airgapped, un-networked environments – contact our sales team to learn more.