
A Comprehensive Guide to Troubleshooting Celery Tasks with Lightrun
This article explores the challenges associated with debugging Celery applications and demonstrates how Lightrun’s non-breaking debugging mechanisms simplify the process by enabling real-time debugging in production without changing a single line of code.
Celery: Powerful but Challenging
Celery is not only a powerful, but also a widely adopted distributed task queue that allows developers to effectively manage and schedule tasks asynchronously. As evident from its GitHub repository, which shows 96k open-source projects utilizing it, Celery has become the go-to tool for Python developers, including those who work with popular frameworks such as Django, FastAPI, and Flask.
Moreover, while Celery’s popularity is a testament to its usefulness, it also means that developers need to be prepared to deal with a high volume of issues. As of now, there are over 7.5k issues on Celery’s Github repository (both open and closed). While a larger number of issues can be indicative of a tool’s popularity, the complexity of Celery’s functionality also plays a role.
That being said, the complexity of Celery’s functionality means that debugging can still be a challenge, even for experienced developers. Without the right debugging tools or approach, identifying the source of an issue can be a time-consuming and frustrating process. It’s not uncommon for developers to spend hours reading through the documentationor manually debugging their code.
The complexity can be particularly daunting when developers need to make changes to their code, deploy it to multiple environments, test it thoroughly, and then push it to production.
Fortunately, Lightrun, the cloud-native observability platform, makes debugging Celery applications more accessible and efficient. Its non-breaking debugging mechanisms allow developers to debug Celery applications in real-time, even in production, without the need to modify the codebase.
This is what we are going to examine in this post. Read on to discover how.
The Code Used in this Example
We are going to start with an application that allows users to book online products and services based on their availability. When handling high-traffic web applications that involve booking services or products, Celery can play a crucial role in ensuring that the application is scalable and efficient. This is why we are going to use Celery mainly for the transactional part.
You can find the source here (celery branch).
These are the database schemas we will be using: a product table, a table for transactions, and a table for orders.
class Product(models.Model):
    product_id = models.UUIDField(primary_key=True, default=uuid.uuid4, editable=False)
    name = models.CharField(max_length=100)
    description = models.TextField(default="Lorem ipsum dolor sit amet, consectetur adipiscing elit, sed do eiusmod tempor incididunt ut labore et dolore magna aliqua. Ut enim ad minim veniam, quis nostrud exercitation ullamco laboris nisi ut aliquip ex ea commodo consequat.")
    price = models.DecimalField(max_digits=10, decimal_places=2, default=10.00)
    stock_quantity = models.PositiveIntegerField(default=10)

    def get_absolute_url(self):
        return reverse("shop:product_detail", kwargs={"product_id": self.product_id})

class Transaction(models.Model):
    transaction_id = models.UUIDField(primary_key=True, editable=False, blank=False, default=uuid.uuid4)
    product = models.ForeignKey(Product, on_delete=models.CASCADE)
    user = models.ForeignKey(settings.AUTH_USER_MODEL, on_delete=models.CASCADE, blank=True, null=True)

class Order(models.Model):
    order_id = models.UUIDField(primary_key=True, editable=False, blank=False, default=uuid.uuid4)
    user = models.ForeignKey(settings.AUTH_USER_MODEL, on_delete=models.CASCADE, blank=True, null=True)
    transaction = models.OneToOneField(Transaction, on_delete=models.CASCADE)
    product = models.ForeignKey(Product, on_delete=models.CASCADE)

    def get_absolute_url(self):
        return reverse("shop:order_detail", kwargs={"transaction_id": self.transaction.transaction_id})

    def get_full_url(self):
        return "{}{}".format(settings.FULL_SITE_URL, self.get_absolute_url())

@receiver(post_save, sender=Transaction)
def create_order(sender, instance, created, **kwargs):
    if created:
        order = Order.objects.create(transaction=instance, product=instance.product, user=instance.user)
        sender = "admin@example.com"
        receiver = instance.user.email
        subject = "Order confirmation"
        message = f"Order for product {instance.product.name} has been confirmed. Your can view your order at {order.get_full_url()}"
        send_mail(subject, message, sender, [receiver], fail_silently=False)
We also have 4 views:
def product_detail(request, product_id):
    product = Product.objects.get(product_id=product_id)
    return render(request, "shop/product_detail.html", {"product": product,})

def process_transaction(request, product_id):
    transaction_id = process_transaction_task.delay(product_id, request.user.id)
    return HttpResponseRedirect(reverse("shop:transaction_detail", kwargs={"transaction_id": transaction_id, "product_id": product_id}))

def transaction_detail(request, transaction_id, product_id):
    message = """
    Order successful.<br>
    You will receive an email with your order details.<br>
    Transaction ID: {}<br>
    Product ID: {}<br>
    """.format(transaction_id, product_id)
    return render(request, "shop/transaction_detail.html", {"message": message})

def order_detail(request, transaction_id):
    order = Order.objects.get(transaction__transaction_id=transaction_id)
    return render(request, "shop/order_detail.html", {"order": order,})
The process_transaction view should handle the payment using a Celery task process_transaction_task.
This is the task:
@task(name="myapp.tasks.process_transaction_task")
def process_transaction_task(product_id, user_id):
		# payment processing simulation
    time.sleep(2)
    product = Product.objects.get(product_id=product_id)
    user = User.objects.get(id=user_id)
    transaction = Transaction.objects.create(product=product, user=user)
    transaction_id = transaction.transaction_id
    product.stock_quantity -= 1
    product.save()
    return transaction_id
Bug Hunting, the Tedious Way
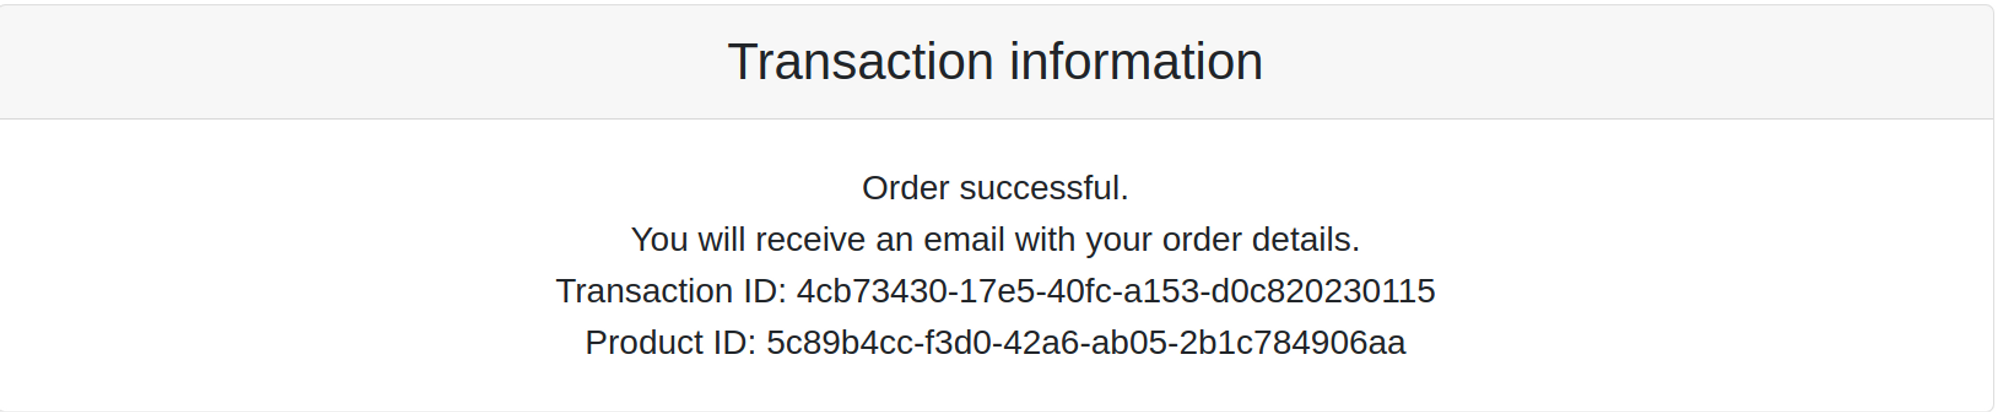
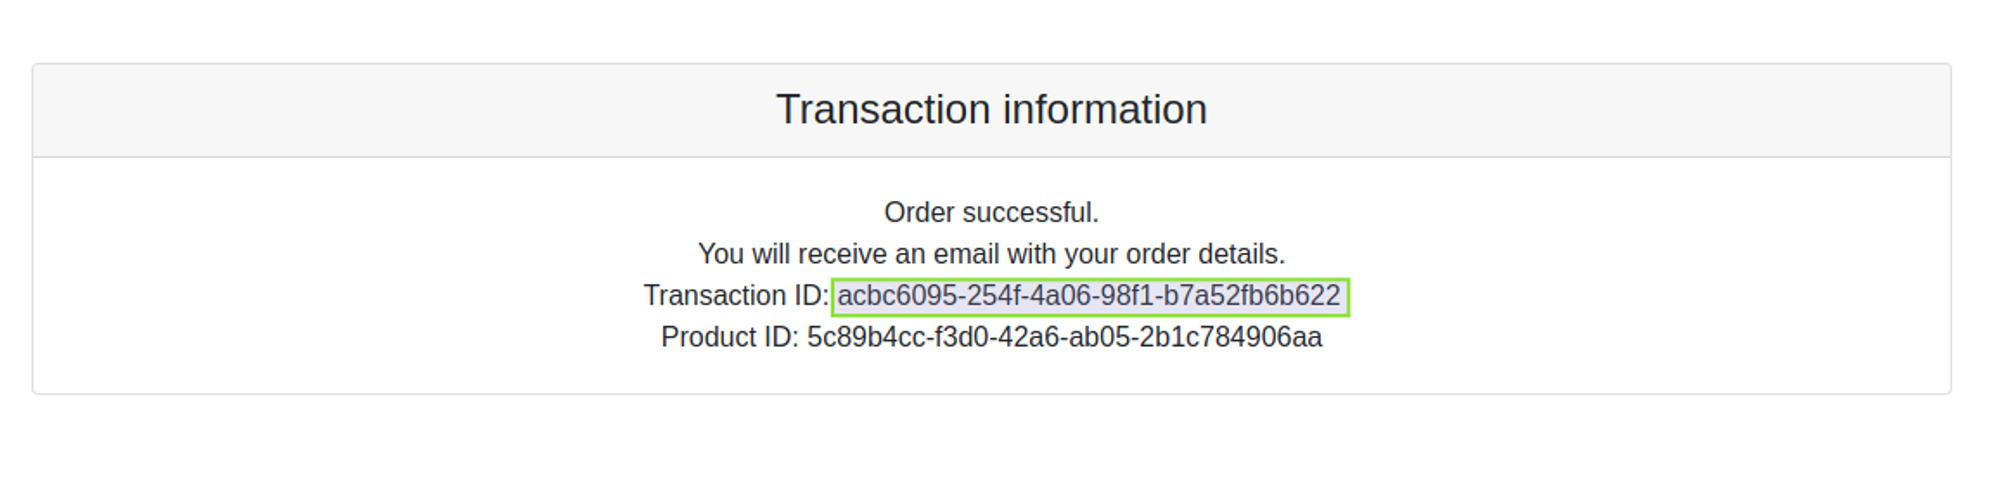
After dockerizing, building, and deploying the application to a Kubernetes cluster, everything appears to be running smoothly until a customer reports an issue with their transaction details. Specifically, the customer claims that the transaction ID displayed on the post-checkout page is different from the one received in their email.
This is the id that shows on the post-checkout page (4cb73430-17e5-40fc-a153-d0c820230115)
While the one that is sent to the user by email is b9454d45-6b7c-462a-8aba-14829927eef4

Such problems are deadly for the coherence and integrity of data in this use case. So how come the transaction ID discrepancy occurred in the first place? One possibility is that there was a bug in the code that caused the transaction ID to be generated incorrectly. Alternatively, there could have been an issue with the email-sending process that caused the incorrect ID to be included in the message.
In a standard development process, developers initiate by examining the code locally, identifying and resolving any existing issues. After rectifying these concerns, they redeploy the code to a testing environment. An automated test or a CI/CD pipeline then assesses the code to confirm that the implemented fixes do not negatively impact other functionalities. Once the code undergoes comprehensive testing and evaluation, it is deployed to production. This procedure might be iterative if the initial attempt at fixing the code is unsuccessful, or when developers require additional logs and traces to better comprehend issues occurring in the production environment.
Bug Hunting, The Lightrun Way
Using Lightrun, the debugging phase will only take a few seconds.
Adding the following code to your celery.py file (where Celery is initiated) is the first step required before starting. Also, you need to create a Lightrun account to get your key.
from celery.signals import task_prerun
import os

@task_prerun.connect()
def task_prerun(**kwargs):
    """
    This function is called before each task is executed. It enables Lightrun to track the task.
    """
    try:
        import lightrun
        lightrun.enable(
            company_key=os.environ.get('LIGHTRUN_COMPANY_KEY'),
            metadata_registration_tags='[{"name": "dev"}]'
        )
    except ImportError as e:
        print("Error importing Lightrun: ", e)
If you are using VSCode, start by installing the Lightrun extension. Lightrun currently supports IntelliJ IDEA, PyCharm, WebStorm, Visual Studio Code (VSCode), VSCode for the web (vscode.dev), and code-server.
Now, let’s go back to the task code:
@task(name="myapp.tasks.process_transaction_task")

def process_transaction_task(product_id, user_id):

# payment processing simulation

time.sleep(2)

product = Product.objects.get(product_id=product_id)

user = User.objects.get(id=user_id)

transaction = Transaction.objects.create(product=product, user=user)

transaction_id = transaction.transaction_id

product.stock_quantity -= 1

product.save()

return transaction_id
Right-click on the last line, click on “Lightrun”, then choose “Insert a Snapshot” from VSCode menu.
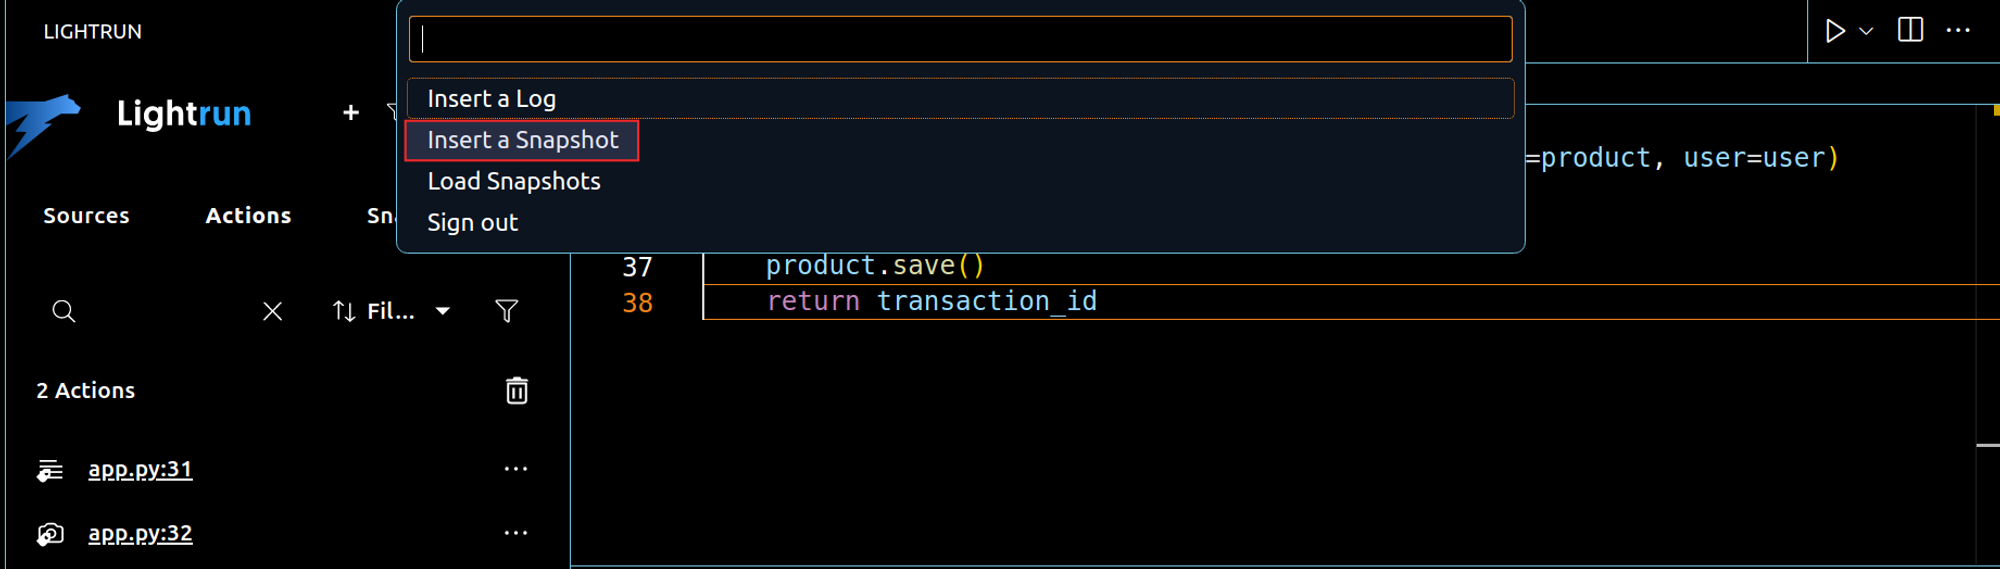
A snapshot is a one-time “breakpoint” that doesn’t block the celery task from running; as opposed to a traditional breakpoint, snapshots collect the stack trace and variables without interrupting the task at all. By replicating the steps taken by your users (in this case, a straightforward checkout), the Lightrun VSCode extension begins capturing the task’s stack trace from the environment configured earlier through lightrun.enable.
For example, in our development environment, we are using:
lightrun.enable(

company_key=os.environ.get('LIGHTRUN_COMPANY_KEY'),

metadata_registration_tags='[{"name": "dev"}]'

)
In our production environment, we can use:
lightrun.enable(

company_key=os.environ.get('LIGHTRUN_COMPANY_KEY'),

metadata_registration_tags='[{"name": "prod"}]'
You will find the different registration tags you manage on the same Lightrun panel. This is how it shows on VSCode:

Back to the snapshot we captured which is available on the “Snapshot” tab in the same panel:
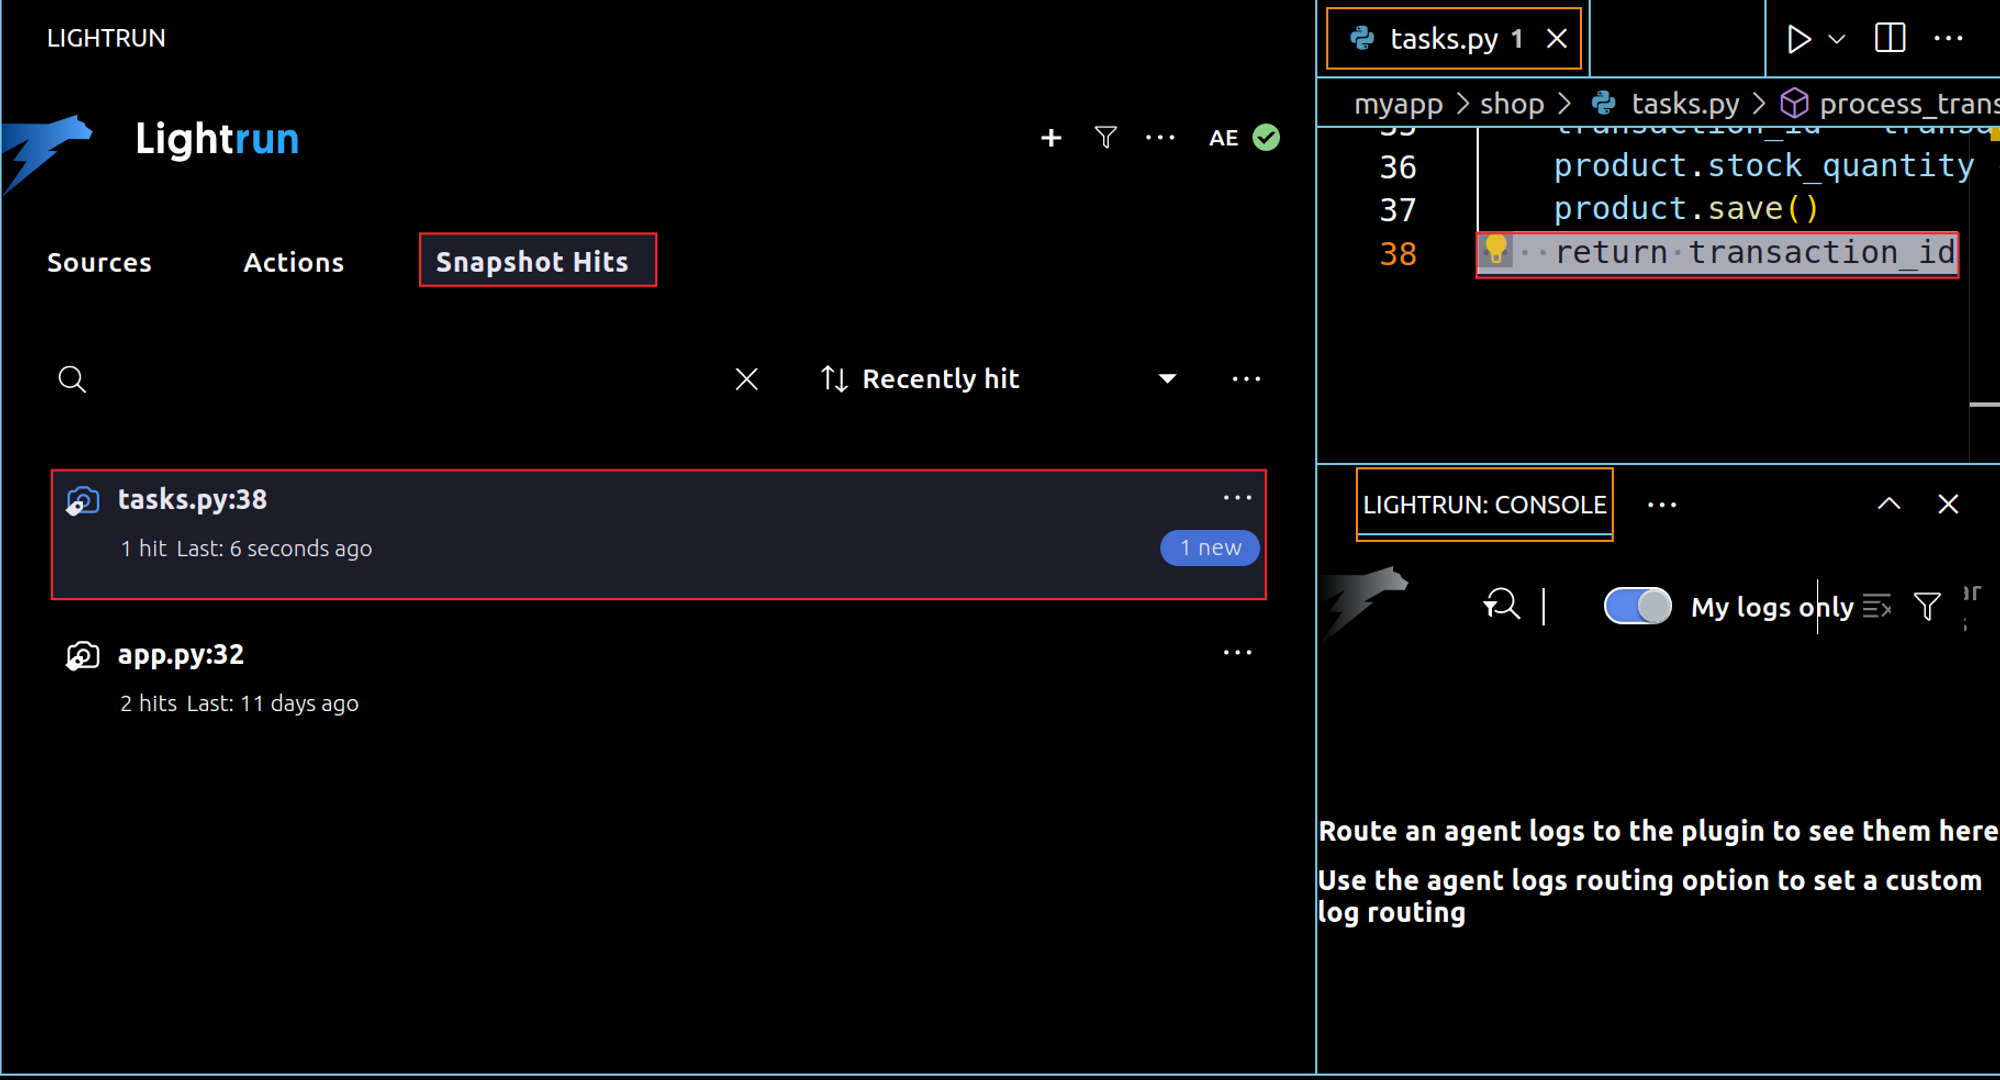
By clicking on the snapshot, you will be able to access the stack trace of the Celery job, including the function itself, the Celery call, the worker, and so on.
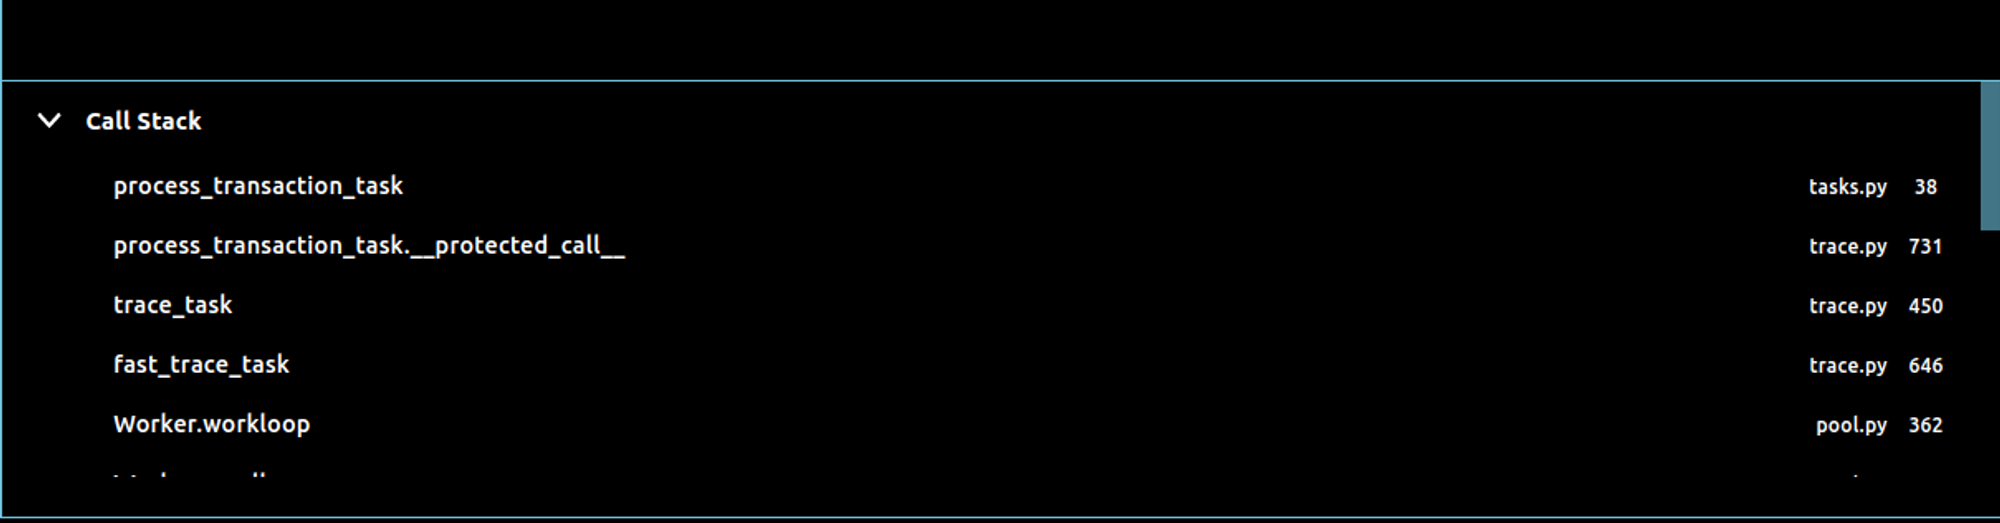
You can start by inspecting the first call, if it is not helpful, move to the second, and so on. For example, after accessing the trace_task which is the second trace, we can see the request dictionary processed by the task.
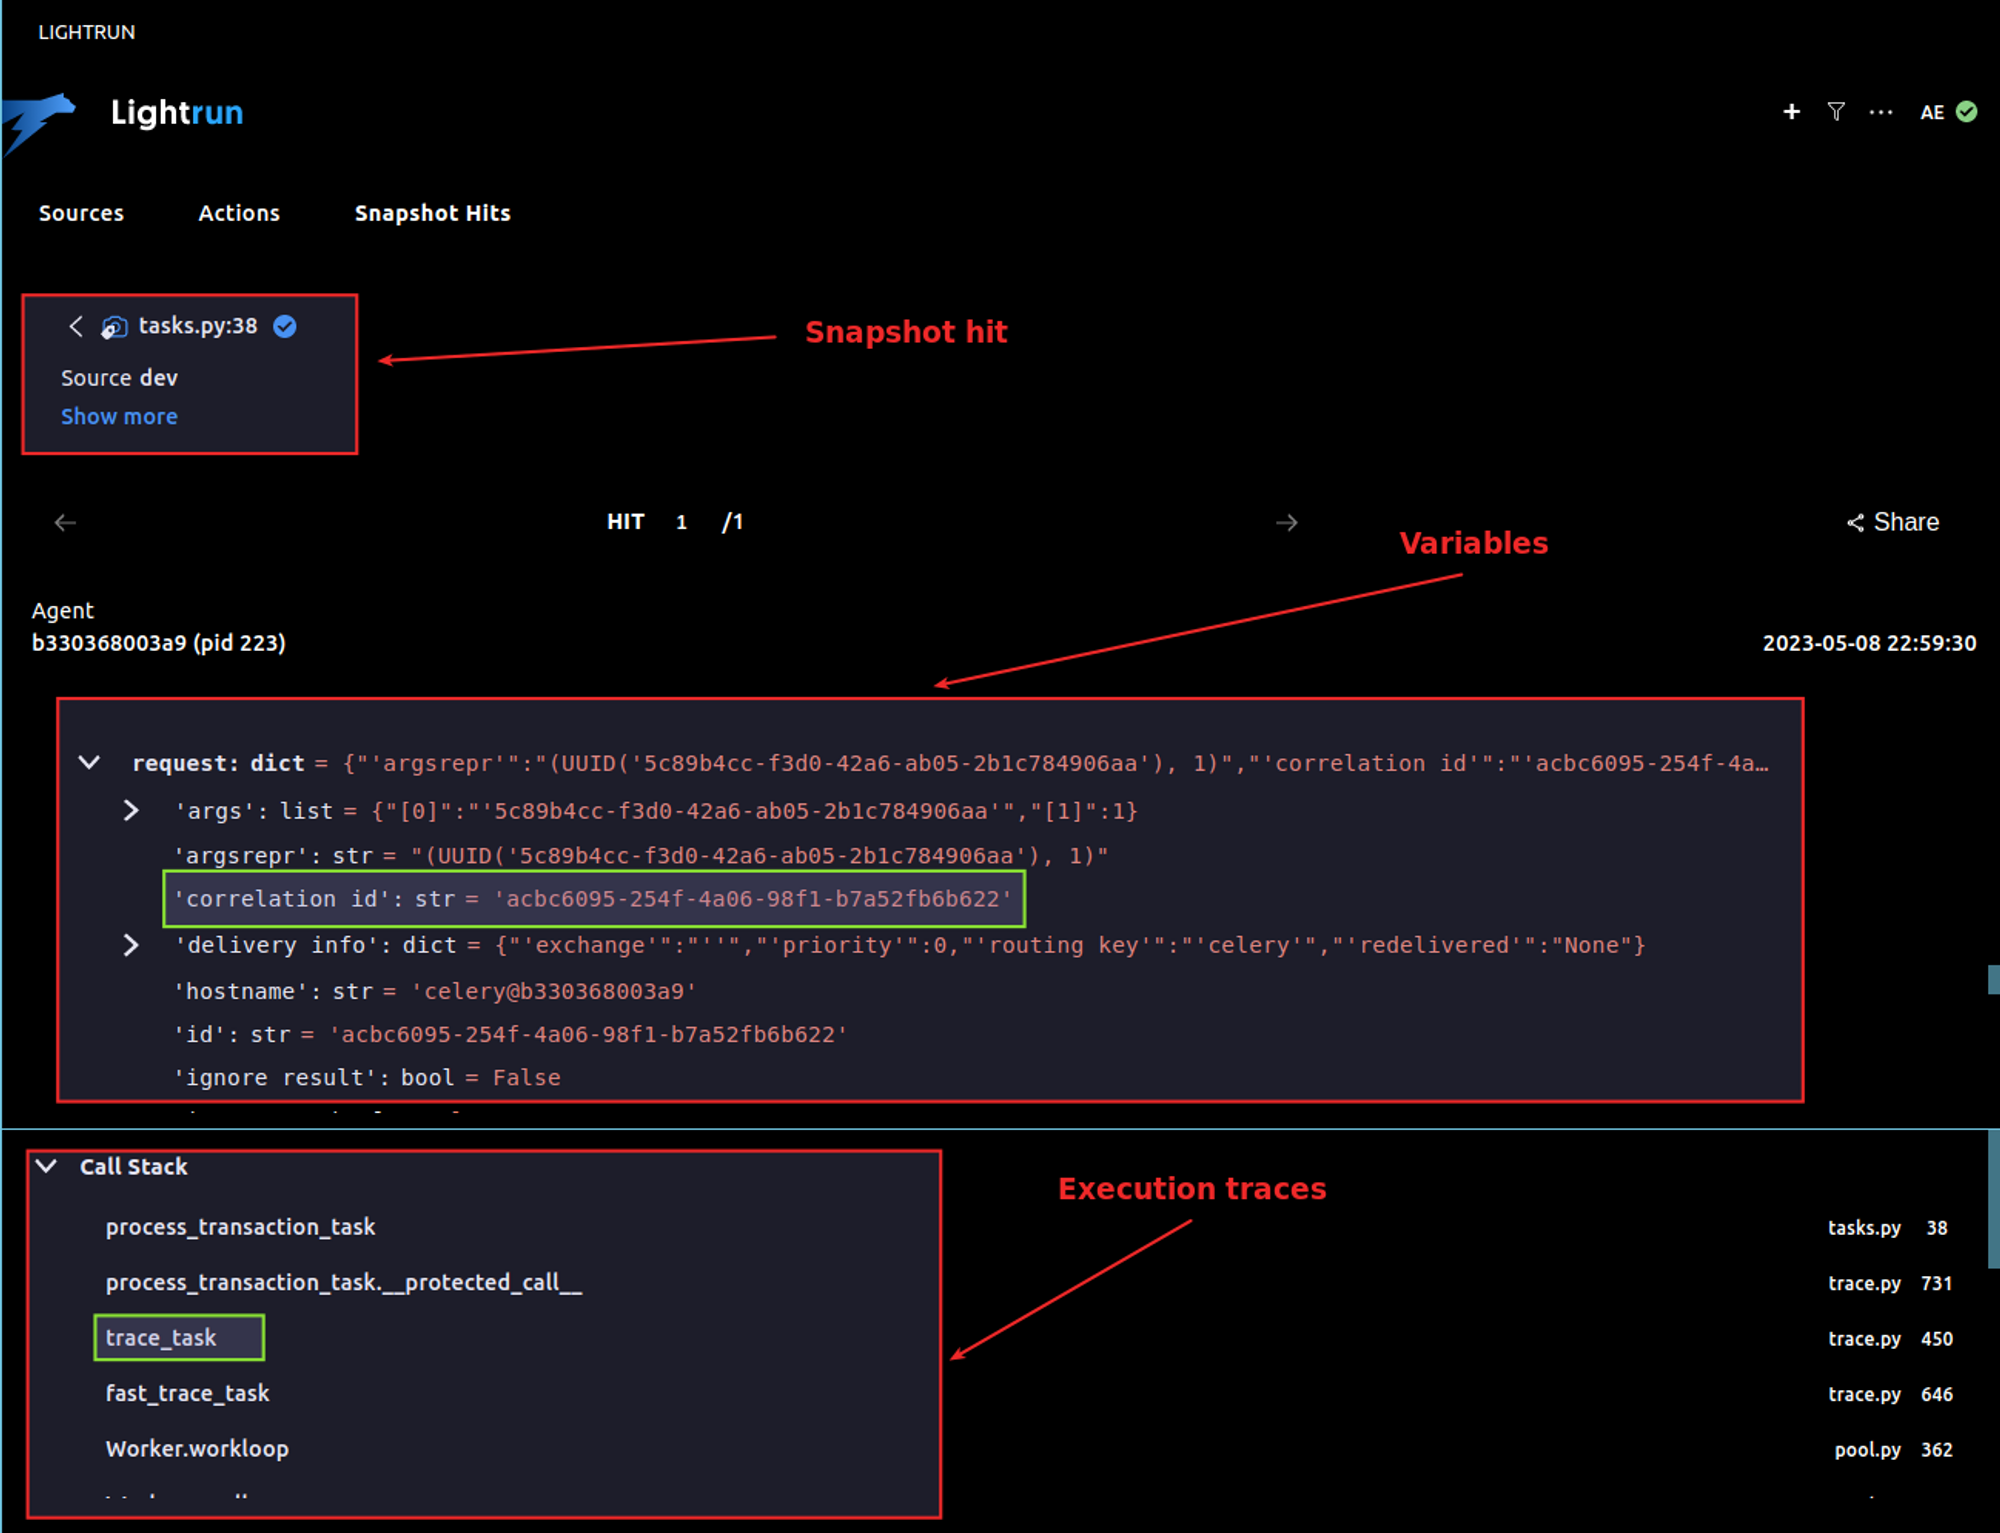
Surprisingly the correlation_id has the same value as the transaction id.
By definition, in the Celery protocol, correlation_id is the task UUID. This means that transaction_id is capturing the value of the Celery task id instead of the real transaction id.
def process_transaction(request, product_id):
>>  transaction_id = process_transaction_task.delay(product_id, request.user.id)
    return HttpResponseRedirect(reverse("shop:transaction_detail", kwargs={"transaction_id": transaction_id, "product_id": product_id}))
This is how by navigating through the stack trace, we were able to understand that there was a bug. In other words, the transaction id is getting a wrong value.
A fix here should be similar to the following:
def process_transaction(request, product_id):
    transaction_id = process_transaction_task.delay(product_id, request.user.id)
    transaction_id.wait()
    transaction_id = transaction_id.result
    return HttpResponseRedirect(reverse("shop:transaction_detail", kwargs={"transaction_id": transaction_id, "product_id": product_id}))
Conditional Filtering – More Accurate Debugging
In specific scenarios, it becomes necessary to filter snapshots based on criteria such as user, product, or other objects or values. This can be achieved by incorporating a conditional statement while applying the same logic:
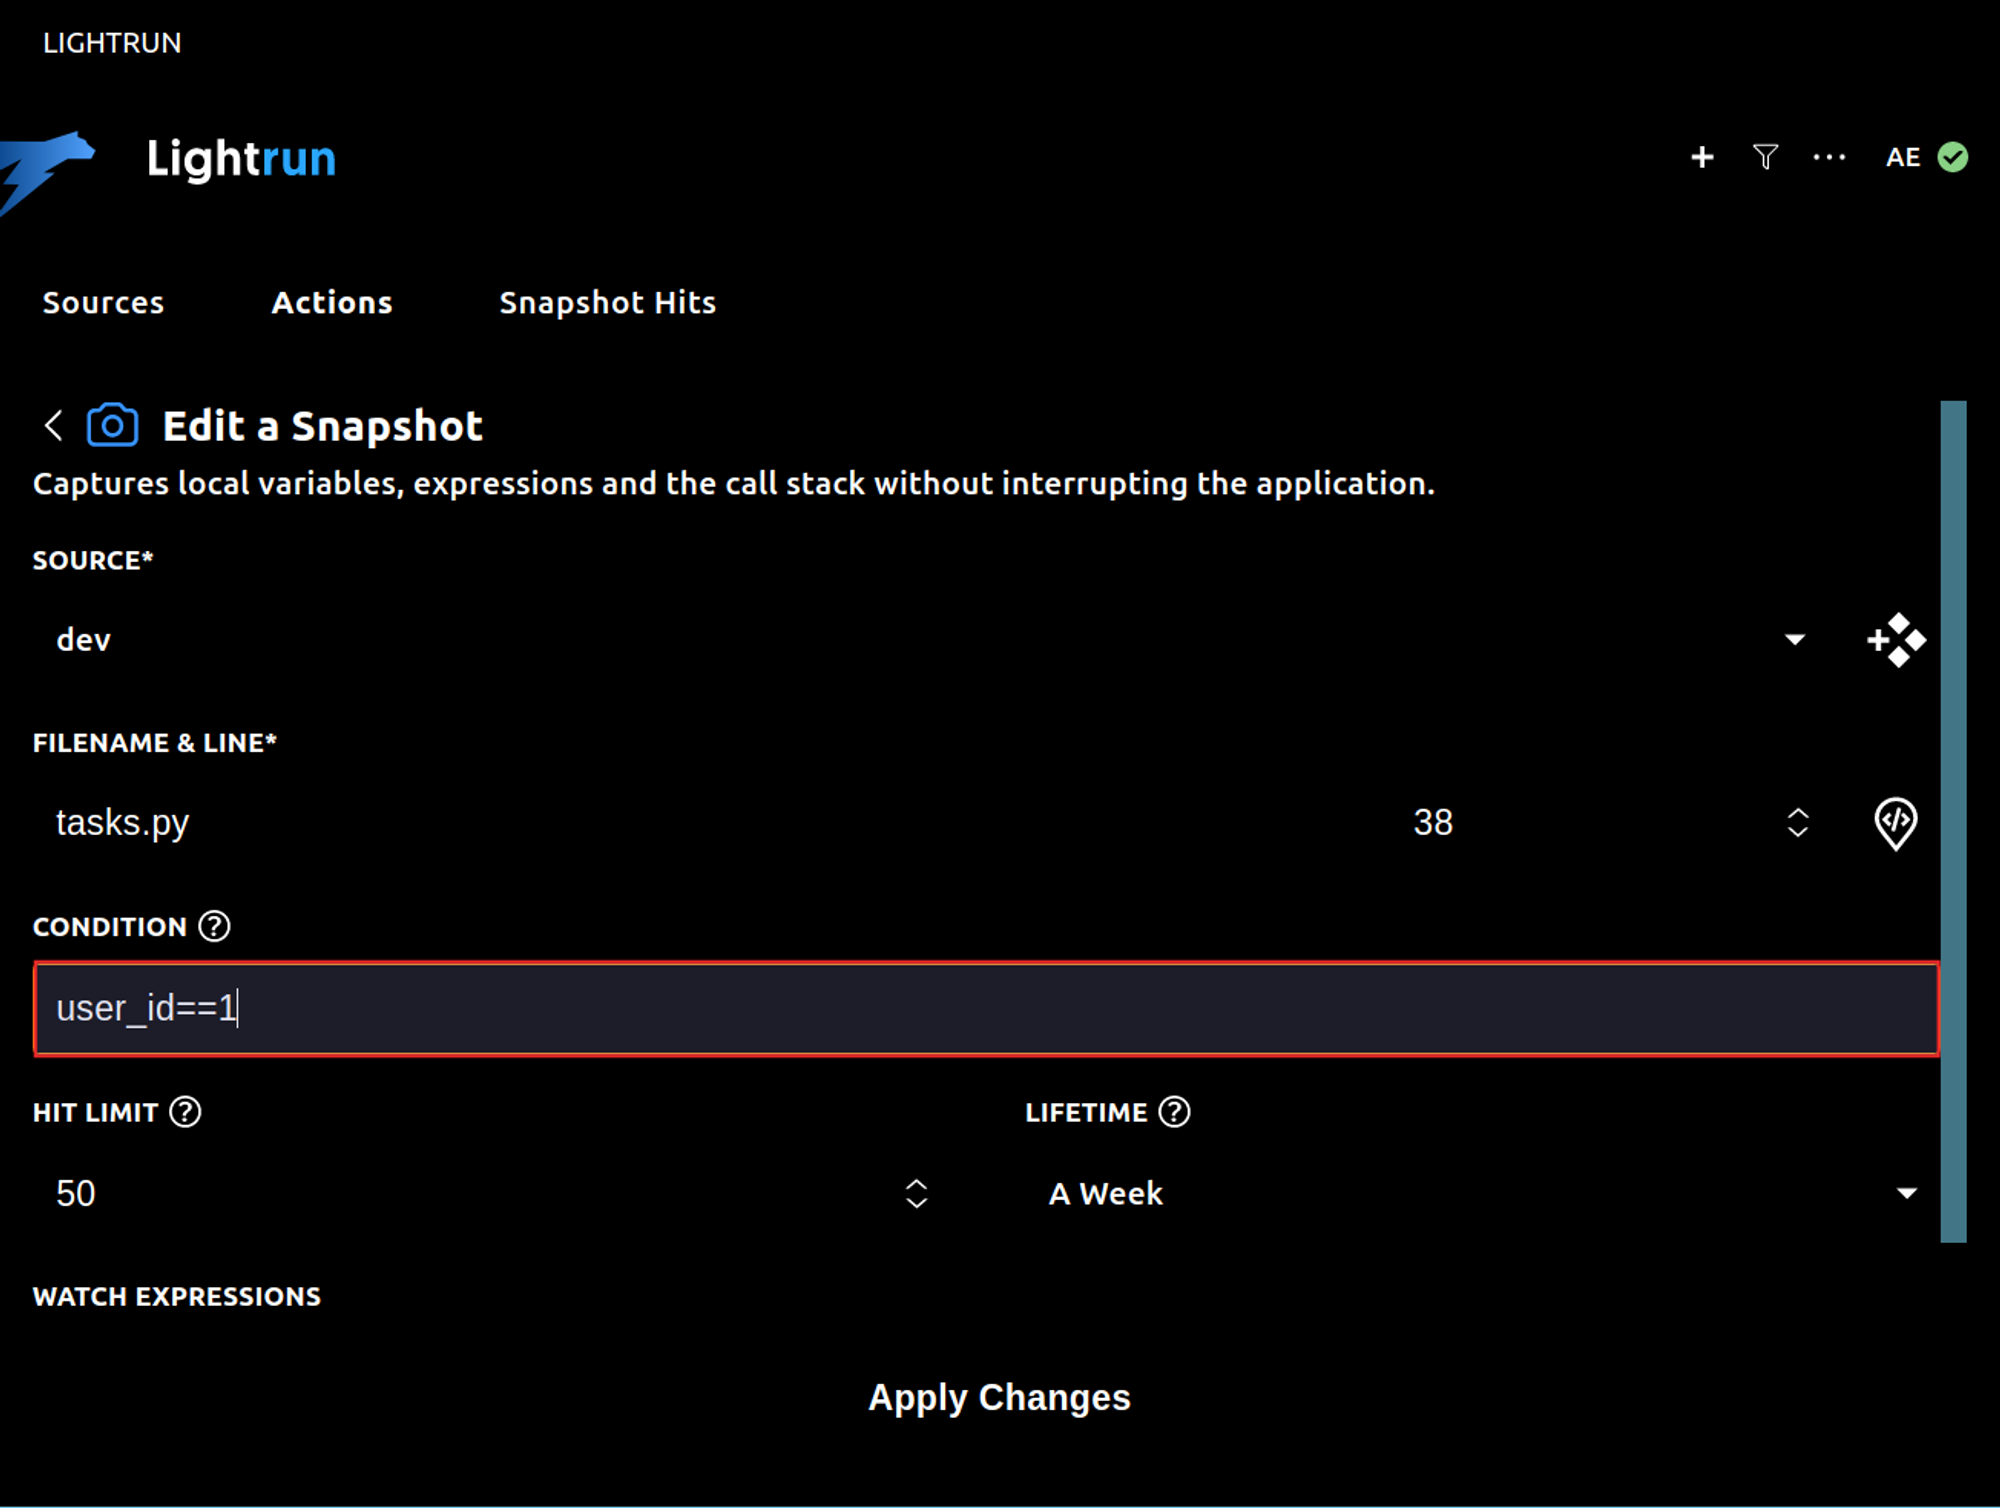
In the given example above, we capture traces exclusively for the user with an ID of 1. However, the condition could be different, such as the product ID. The range of applicable conditions depends on your specific use case. Ultimately, this feature enables more precise debugging experiences.
Instant Access to Observability
What sets Lightrun apart is its ability to allow developers to debug their code in production, without the need to add a single line of code to their codebase. This means that developers can diagnose and fix issues in real-time, as they arise, without having to go through the traditional debugging process of deploying, testing, and re-deploying their code.
Lightrun achieves this by using “non-breaking breakpoints” that allow developers to inspect and modify the state of their running application, without interrupting its execution. This means that developers can gain full visibility into the execution of their Celery tasks, as well as the values of variables and functions, in real-time.
Using Lightrun to debug Celery applications is a game-changer for software engineering teams as it saves time, effort, and resources. As a result, software teams, including developers, operation, and observability teams, can achieve a quicker time-to-market, enhanced user experiences, and increased overall productivity
Using Lightrun with Celery is straightforward, and it can be integrated seamlessly into any Celery-based application. With just a few clicks, we have got immediate feedback on an ambiguous issue that arose in production without the need to redeploy a new code.
What’s next?
You can start using Lightrun today or request a demo to learn more. Alternatively, take a look at our Playground where you can play around with Lightrun in a real, live app without any configuration required.


It’s Really not that Complicated.
You can actually understand what’s going on inside your live applications.