Code Instrumentation in Cloud Native Applications
Cloud native is the de facto standard approach to deploying software applications today. It is optimized for a cloud computing environment, fosters better structuring and management of software deployments. Unfortunately, the cloud native approach also poses additional challenges in code instrumentation that are detrimental to developer productivity.
In this post, we will unravel some of these challenges to understand the impact of cloud native application development on code instrumentation, with an emphasis on production debugging.
Conflict Between Cloud Native Principles and Code Instrumentation
Cloud native applications need a special deployment configuration. Unlike typical software running on a personal computer, these applications are supposed to withstand extreme scalability to user traffic and super flexibility to changes and updates.
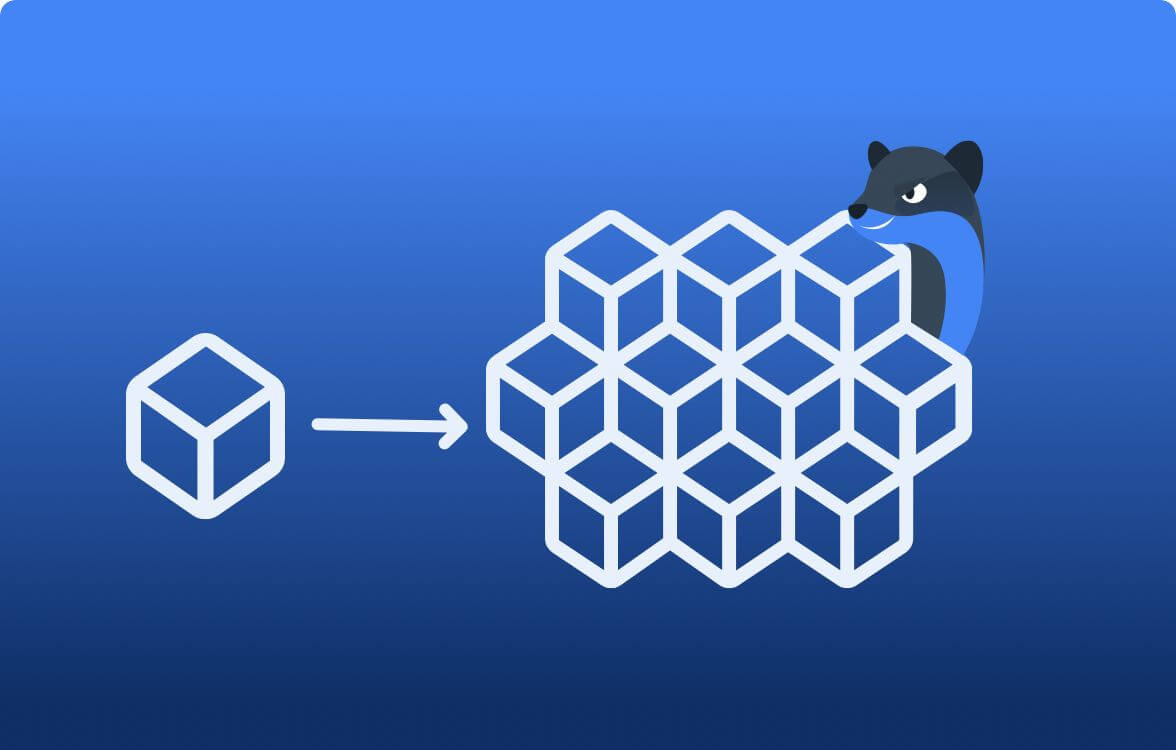
Cloud native deployments follow three principles: granularity, modularity, and redundancy.
- Granularity ensures that each application component is right-sized to contain the bare minimum tooling and business logic required to run it as an independent service.
- Modularity ensures that each service is designed to perform a single responsibility, and creates the perfect balance in coupling and cohesion among dependent services.
- Redundancy guarantees that all services are deployed in multiples such that the application is always available, no matter how many user access it.
As a result, the codebase of a cloud native application is deployed in a highly distributed environment, which leads to increased debugging effort on the part of a developer.
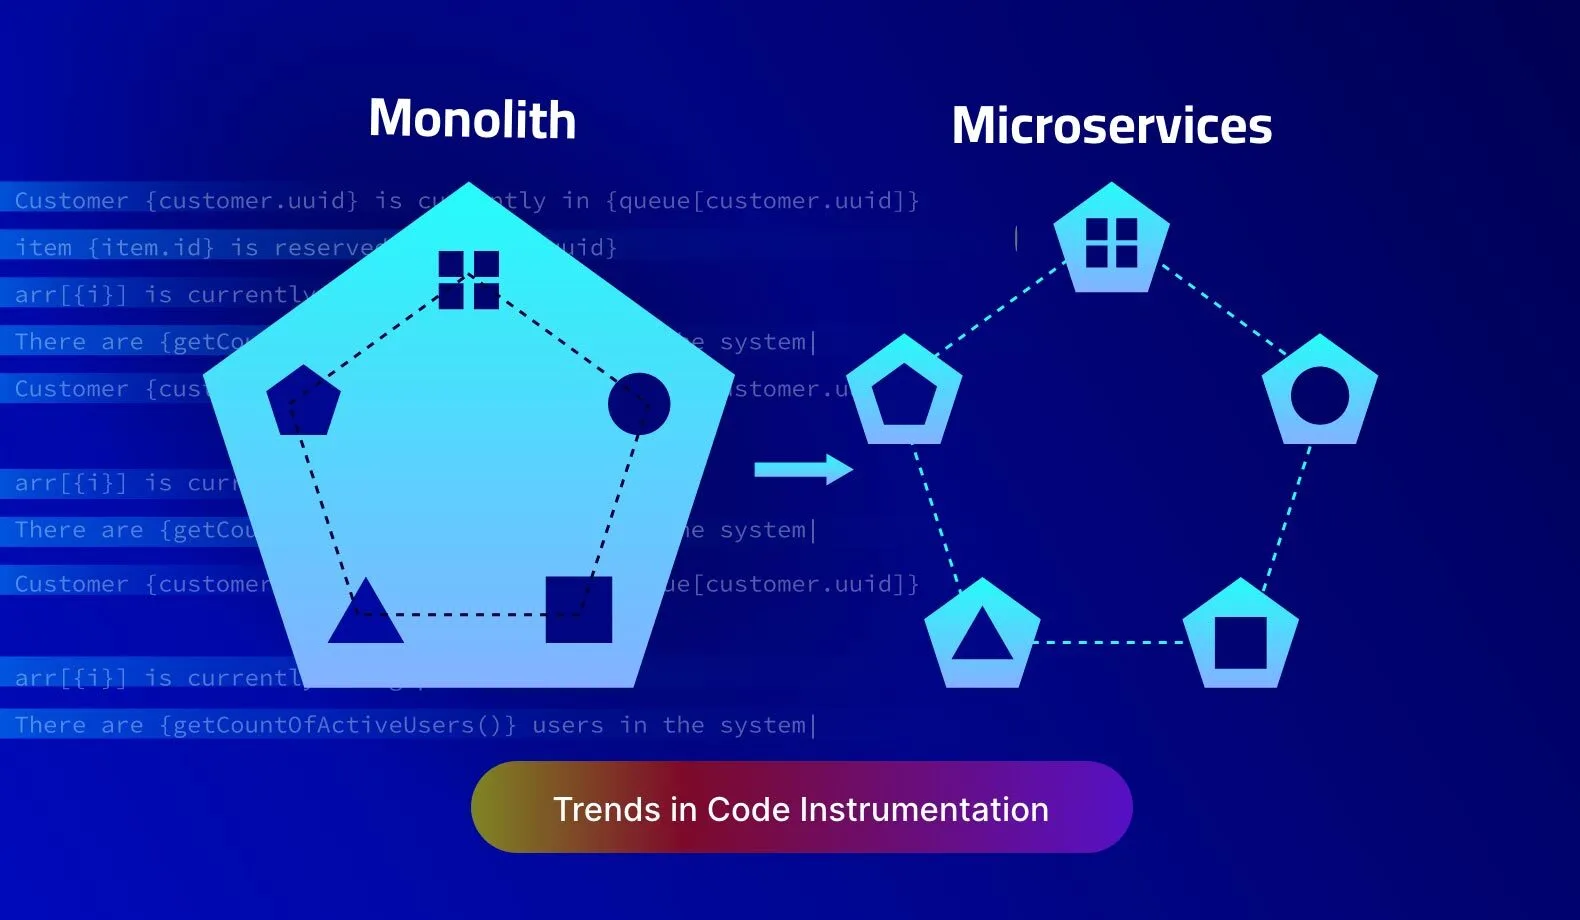
During any debugging effort, code instrumentation helps bridge the gap between the codebase and runtime deployment. However, traditional code instrumentation techniques evolved from monolithic architectures. These architectures had a much simpler deployment configuration, compared to the modern microservices architecture, on which cloud native deployment is based upon.
At Lightrun, we understand these challenges of code instrumentation with microservices architecture. Therefore the Lightrun platform is designed to offer developers complete visibility on a live cloud native application, down to the most granular level of a containerized service.
Let’s analyze the five key challenges of code instrumentation in a cloud native deployment, and how Lightrun addresses these challenges for a better developer experience.
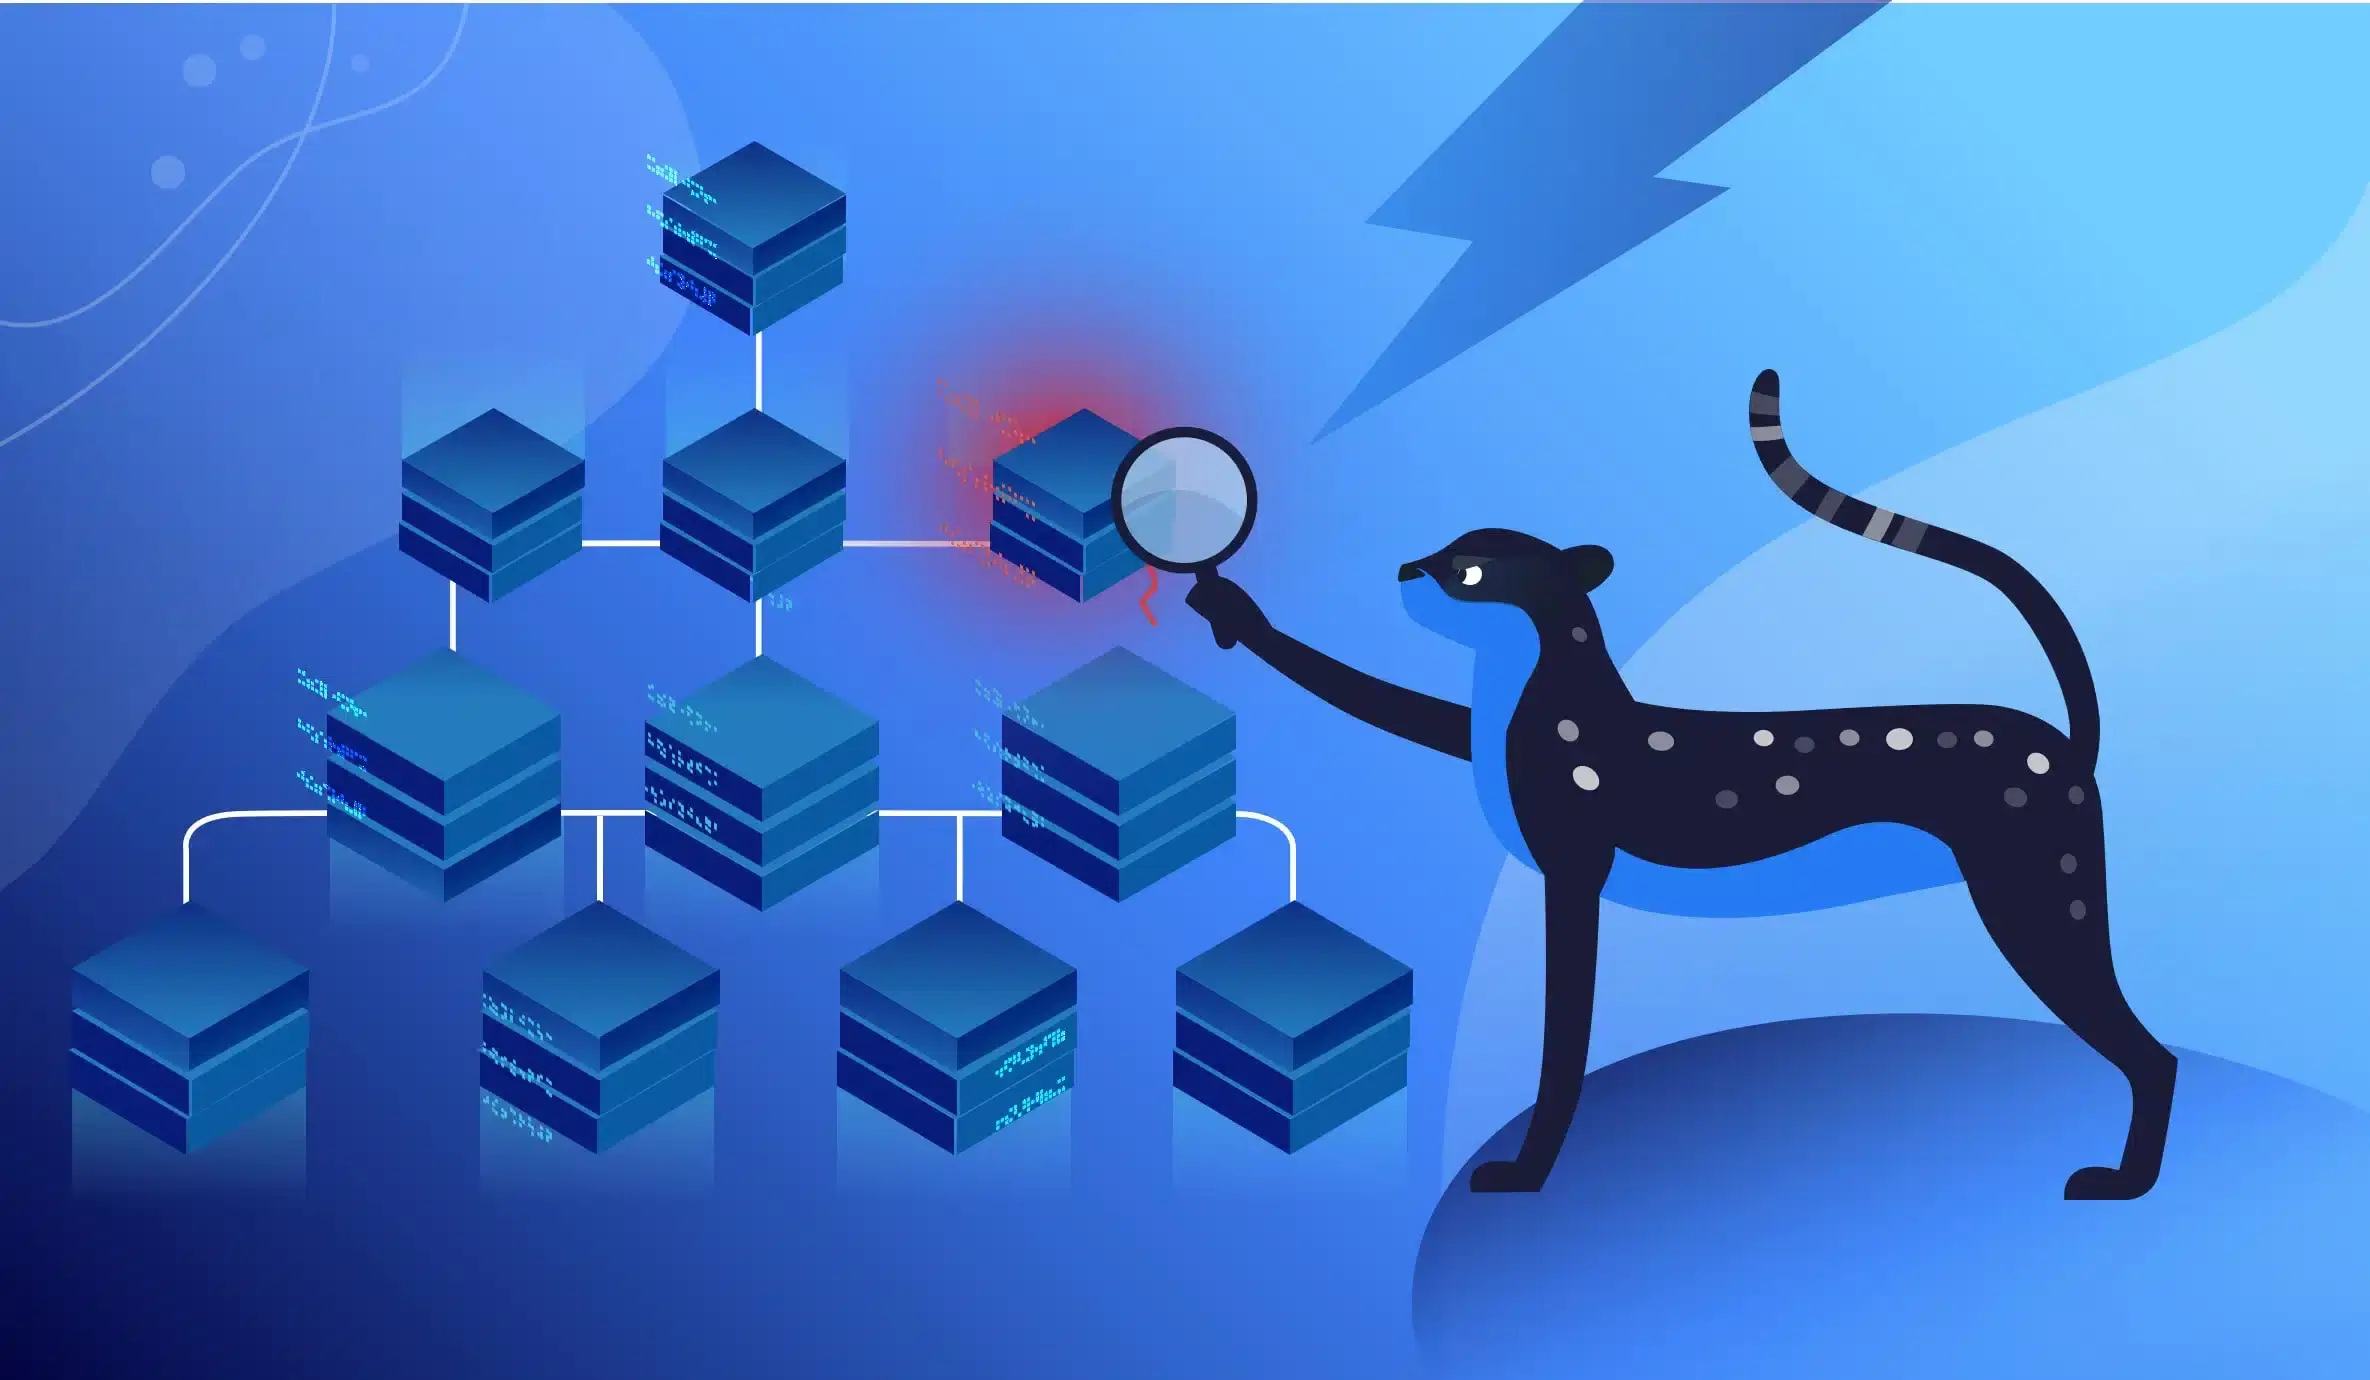
Challenge 1: Misguided Root Cause Analysis
Cloud native applications run in distributed environments. There are multiple layers of abstraction and many dependencies, each of which is exposed as a separate runtime service. This arrangement makes it difficult to understand what is happening in the system and to identify the root cause of issues.
Take the case of a Kubernetes environment. Debugging an application deployed on a Kubernetes cluster entails:
- Dealing with multiple instances. In order to effectively debug a Kubernetes-based application, a developer has to access multiple replicas of the same application running in multiple pods/nodes and multiple clusters.
- No direct access to runtime environment. In a Kubernetes environment, the runtime of an application is distributed as containers, which are shipped with the bare minimum tooling and libraries to avoid bloat in CI/CD pipelines. In many cases, developers do not have shell access to allow basic troubleshooting for arriving at the root cause.
With Lightrun’s support for Kubernetes, developers can add dynamic logs to live pods, without restarting the Kubernetes cluster or enforcing config changes such as port forwarding.
Challenge 2: Managing Overheads Due to Code Instrumentation
Code instrumentation has its own overheads which may seem irrelevant to developers but will lead to business-impacting overruns in a production environment:
- Cost overruns in overlogging. Traditional code instrumentation practices require adding log and trace statements in the code. But even an innocuous-looking log statement can lead to a ton of log data accumulation if the code surrounding that log statement is executed frequently. This is called overlogging and can drastically increase the cost of log storage.
- Performance bottlenecks. Similarly, too much code instrumentation can impact the runtime performance of the core business logic of your application. This happens when metrics are collected frequently, which requires additional arithmetic and logic computation as part of the code execution.
While these issues are not specific to cloud native applications, they certainly get amplified more compared to traditional monolithic applications, because of the large-scale replication and distributed nature of cloud native deployments.
With Lightrun, developers can attach code instrumentation at runtime and analyze the output under a single window, either in the IDE or within the Lightrun Management Portal. These logs are read-only, performant, and can be disabled anytime.
Challenge 3: Maintaining Sanctity of Runtime Environment
Code instrumentation has a perception of altering the behavior of runtime since it enables a developer to inject additional code. Unless strictly monitored, this can lead to one of the following failures in a cloud native application:
- Cascading failures. Cloud native applications are designed as interdependent services, creating a chain of service dependencies. Under these circumstances, injecting a breakpoint in one service often leads to a cascading failure in other services dependent on it.
- Deadlocks. The same breakpoint can lead to a deadlock if there is a circular dependency between services.
- State/context changes: If a debugger is used to change various values in the application and modify the internal state, it can have catastrophic consequences on runtime behavior.
These are the scenarios where code instrumentation can cause further malfunctioning of the runtime, over and above the reported bugs. Within a cloud native environment, developers have to use their intuition to unearth these problems, which requires some skill level that is much beyond the abilities of a rookie programmer.
With Lightrun, there is no need to halt or redeploy a production application for adding debugging logs, snapshots or metrics.
Challenge 4: Maneuvering the Complexities of CI/CD Pipelines
Cloud native deployments have many moving parts compared to traditional monolithic architectures. Usually, they are segregated based on environments that span across, developer workflows, testing, and QA stages, server clusters, and geographical distribution.
As a result, CI/CD pipelines are architected to keep all the environments in sync with the latest and upcoming releases. However, debugging a live application entails spawning additional environments for recreating and fixing the bugs. That makes the CI/CD pipeline configuration very complex.
With Lightrun, developers can interact with live applications without relying on DevOps to spawn a custom environment to recreate the debugging scenarios.
Challenge 5: Meandering the Dynamics of a Cloud Native Application
Cloud native environments are often dynamic, with resources being created and destroyed on demand.
For example, a Kubernetes cluster can be configured to run with a predefined set of pods, with an auto-scaling configuration to increase the pod replicas with an increase in traffic. This creates additional pods which are later destroyed when the traffic reduces to normal levels. In such cases, code instrumentation generates telemetry data for the additional pods which cease to exist at a later point in time. Therefore, it is hard to reproduce scalability issues where telemetry data is mapped to a non-existent runtime environment.
Under Lightrun, every runtime environment, be it a container, or VM or a bare metal can be observed through code instrumentation, irrespective of whether it is a permanent or ephemeral component.
Are you are struggling with production debugging for your cloud native application? Be it on Kubernetes, or any other form of serverless deployment, the Lightrun platform alleviates all your debugging chores with an IDE-based, local-like debugging experience. You can start using Lightrun and take charge of your application uptime without the overheads of DevOps.
It’s Really not that Complicated.
You can actually understand what’s going on inside your live applications.