Debugging Serverless Functions with Lightrun
Developers are increasingly drawn to Functions-as-a-Service (FaaS) offerings provided by major cloud providers such as AWS Lambda, Azure Functions, and GCP Cloud Functions. The Cloud Native Computing Foundation (CNCF) has estimated that more than four million developers utilized FaaS offerings in 2020. Datadog has reported that over half of its customers have integrated FaaS products in cloud environments, indicating the growth and maturity of this ecosystem. By delegating the responsibility of managing the underlying infrastructure to cloud providers, FaaS is a cost-efficient way of running event-driven functions.
Functions as a Service Pain Points
You may find that adopting FaaS comes with some challenges surrounding debugging and troubleshooting. Since the infrastructure is abstracted, it becomes challenging for developers to quickly identify the root cause of problems. Attaching debuggers or profilers isn’t as straightforward. You will often find yourself restricted to scrutinizing logs and metrics, which can be difficult to analyze, particularly when scaling up your operations.
You may be facing other challenges when working with FaaS. Debugging and obtaining memory dumps can be difficult when running the function locally without a framework. It may be challenging to determine resource usage (RAM, CPUT) and concurrency/timeout values. It is important to reduce cold starts to optimize performance. Latency issues may arise while the function is running, and time limits may prevent sufficient logging and metric gathering. Lastly, languages such as NodeJS may produce early returns, which can hinder debugging efforts.
Current Solutions
To monitor execution and alert on issues like timeouts and memory growth, high-level monitoring tools such as APMs and distributed tracing tools can be used in addition to logs and metrics. Tracing tools designed for serverless, such as epsagon and lumigo, can also expose and connect relevant logs. However, if additional information is required, extra logs must be added and redeployed.
Alternatively, developers can utilize a framework like AWS SAM CLI to invoke the function locally and test it with stubs, along with a debugger. However, replicating production workload locally is challenging, which makes pinpointing issues difficult.
There are also new solutions, such as Serverless Debugger, that enable live debugging by generating dynamic log lines. Nonetheless, language or IDE support remains limited.
Lightrun
Lightrun offers developers a unique solution for troubleshooting serverless functions using dynamic logs and snapshots. There’s no need for developers to redeploy their functions when they need more debugging information. With Lightrun, developers can capture any data from their serverless functions on demand. Lightrun supports several languages such as Python, NodeJS, JVM languages, and popular IDEs like VSCode, IntelliJ, and PyCharm, along with multiple integrations with existing observability toolkits like Datadog, FluentD, Logz.io, Dynatrace, Prometheus, and more.
To show you how it works, I’ll use an example of a NodeJS function that polls the Coingecko API for Bitcoin price on AWS Lambda and debug them together.
Prerequisites
Start by setting up a Lightrun account, and retrieve your secret key. You’ll also need an AWS Account. In this demonstration, we will be utilizing the VS Code Plugin. However, it is possible to use any of the supported plugins, such as JetBrains IDEs and Web IDEs, to follow along.
Setting up Lightrun Lambda Layer
In order to interact with Lightrun on AWS Lambda, you need to deploy Lightrun’s agent with the application. One convenient way to package this agent is to utilize AWS Lambda Layers that can be imported at runtime into your Lambda function.
To create a Lambda layer, we will compile and bundle the agent into a zip file. First let’s create a new directory and initialize npm:
mkdir lambda_layer
cd lambda_layer
npm init -y
Then we will install Lightrun:
npm install lightrun
Finally, we can compile all the dependencies into a zip file. For convenience, update package.json to have a `build` script as the following and run `npm build`:
"scripts": {
"build": "npm install && mkdir -p nodejs && cp -r node_modules nodejs/ && zip -r layers.zip nodejs"
}
Now we have a `layers.zip` file with Lightrun agent.
Next, we need to upload this zip file to AWS as an Lambda layer. We can invoke the AWS CLI with the following command:
aws lambda - region us-east-1 publish-layer-version - layer-name 'Lightrun_Package_node' - compatible-runtimes 'nodejs14.x' - zip-file fileb://layers.zip
Once it’s successful, you should see the output JSON. Take a note of the `LayerVersionArn` and export it to your shell:
export LAYERS_ARN=<layers-arn>We are now ready to include this layer in our Lambda applications. But in order for us to actually invoke Lambda functions, we need to create an execution role. Follow the AWS guide to create an execution role and set that ARN in our shell for later:
export LAMBDA_ROLE_ARN=<lambda-execution-arn>Creating & Deploying the Lambda Function
To illustrate how Lightrun works, let’s take a simple Lambda function that repeatedly polls Coingecko API for the price of Bitcoin. Note that we are intentionally not handling errors or timeouts well so we can debug.
Create a new directory and add the following code in `index.js`:
const lightrun = require("lightrun");
const axios = require("axios");


async function lightrunStart() {
 try {
   await lightrun.start({
         lightrunSecret: process.env.LIGHTRUN_SECRET,
         lightrunWaitForInit: true,
         lightrunInitWaitTimeMs: 10000,
         metadata: {
           registration: {
              displayName: "node-lambda-function",
              tags: ['node-lambda-function']
           }
         }
     });
     console.log('lightrun started');
 } catch(err) {
   console.log("error starting Lightrun", err);
 }
}


async function fetchBitcoinPrice() {
 for (let i = 0; i < 100; i++) {
   try {
     const response = await axios.get('https://api.coingecko.com/api/v3/simple/price?ids=bitcoin&vs_currencies=usd');
     const price = response.data.bitcoin.price;
     await new Promise(r => setTimeout(r, 5000));
   } catch (error) {
     console.error(error);
   }
 }
}

exports.handler = async (event, context) => {
 const lightrun = await lightrunStart();
 await fetchBitcoinPrice();
};
To deploy this to Lambda, we will zip the file and invoke the AWS CLI again. Since this function expects the Lightrun key as an environment variable, we need to also pass this in:
zip function.zip index.js
aws lambda create-function \
 - region us-east-1 \
 - function-name get-bitcoin-price \
 - zip-file fileb://function.zip \
 - role $LAMBDA_ROLE_ARN \
 - handler index.handler \
 - runtime nodejs14.x - timeout 120 - memory-size 512 \
 - layers $LAYERS_ARN \
 - environment Variables="{LIGHTRUN_SECRET=<your-key-here>}"
Note that we created a Lambda function called `get-bitcoin-price` with a timeout of 2 minutes.
Dynamic Logging
Now for the exciting part! We can begin real-time debugging of this Lambda function. Navigate to the AWS console and activate this AWS Lambda function. You’ll notice that it times out after 2 minutes, displaying only a basic “lightrun started” message with no logs. We are currently unaware of what is occurring within the function. Although we don’t see any error logs, we neglected to log the price of Bitcoin we were searching for. So, let’s observe it in real-time.
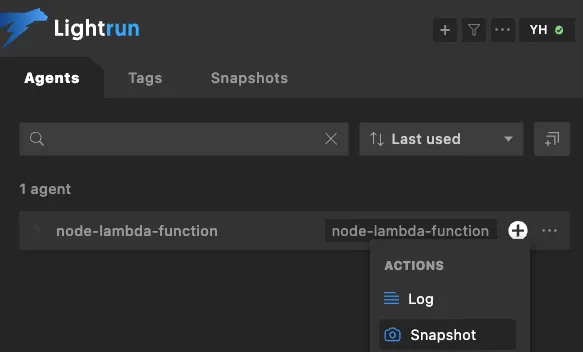
Activate the function once more and launch the VS Code Lightrun Agent:
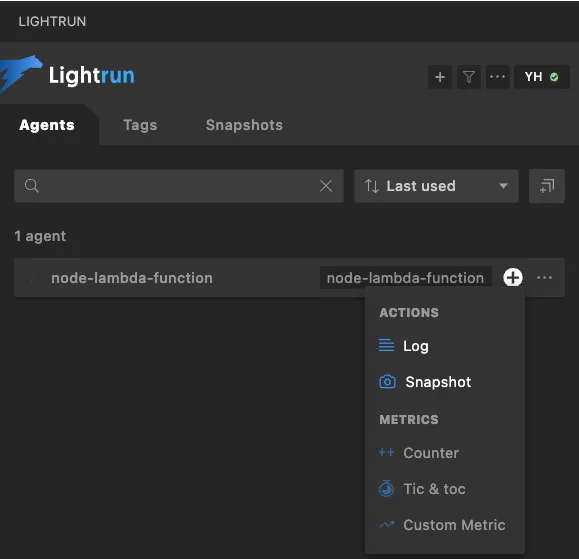
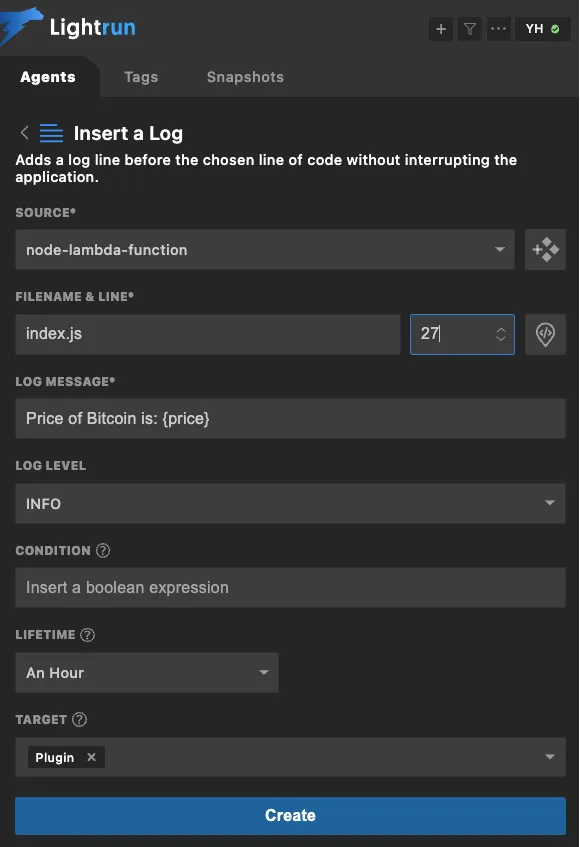
Click on the Log Action on the `node-lambda-function` agent that it detected. Then let’s put in a log for the price of Bitcoin we’re interested in on line 27:
Then we can see in the Lightrun Console what the price is:
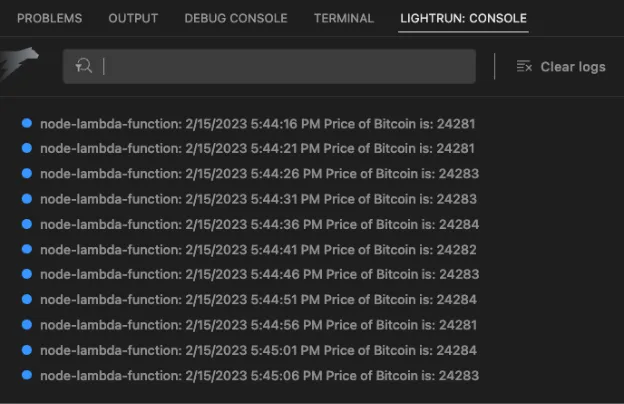
So it seems like our API call is returning correctly, yet the function times out. To see what else could be wrong, we can take a snapshot.
Taking a Snapshot
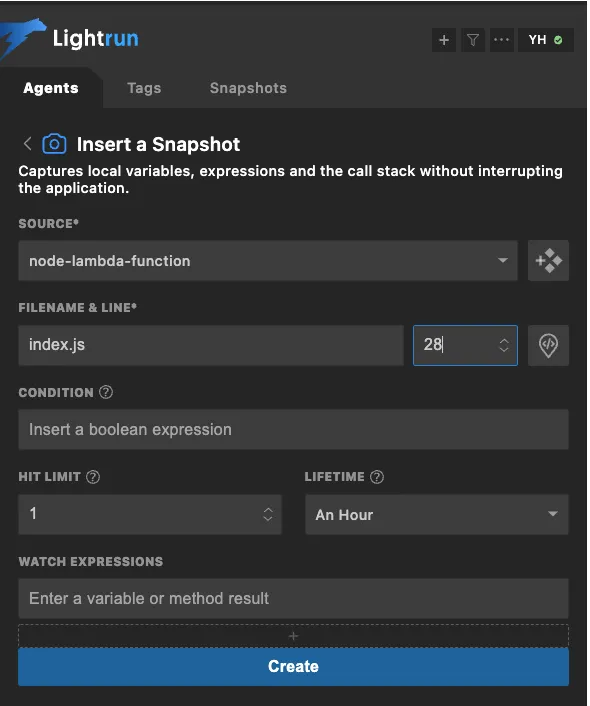
Re-run the Lambda function and this time let’s take a snapshot:
We can take a snapshot on line 28:
Drilling down into the snapshot, we can see the variables involved as well as our call stack:
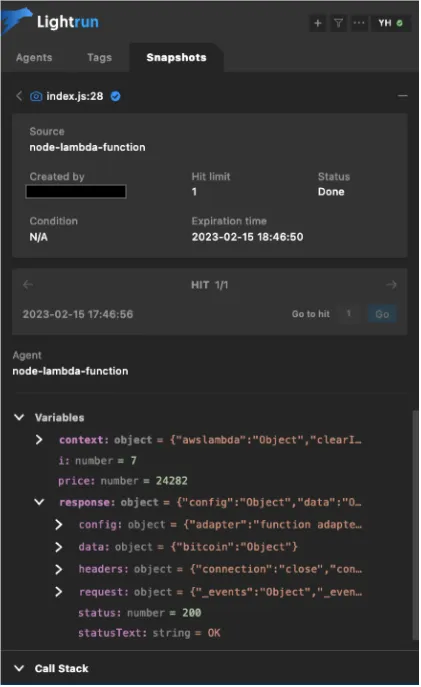
Here we can see that we are looping through (currently at i = 7) but since we’re waiting 5s between each call, we are actually timing out before our Lambda execution time limit (500s > 120s). We need to bump up our execution time limit or handle this failure more gracefully.
Easier debugging and Logging
Debugging a serverless stack is often challenging as most of the infrastructure is fully managed by the service provider and not open for troubleshooting. If your deployed application does not already have proper logging, then this means that to troubleshoot your function, you must redeploy. With Lightrun, you can now utilize the agent to dynamically add logs and takes snapshots that are only visible in the Lightrun console. This gives you a better view of the system without modifying the source code.


It’s Really not that Complicated.
You can actually understand what’s going on inside your live applications.