How to Debug Remotely in IntelliJ IDEA
May 06, 2021 / Updated: Mar 08, 2026


Debugging is one of the most critical aspects of the software development cycle. Being able to debug is a core skill every developer needs to have in order to provide valuable, scalable solutions.
For applications running on remote servers and computers, developers turn to remote debugging to identify issues that can’t be reproduced locally. For example, you might run a smaller instance of your database locally to test with, but when pushed to a production load, bugs might surface related to large data sets. Or you might not run the same permission and firewall restrictions when developing locally that you do in production. This can lead to bugs that are impossible to reproduce locally without a significant investment in tooling.
With remote debugging, you can remotely control a target utilizing a debugger instance running on a different machine. The debugger instance, also referred to as a debug engine, runs on the same machine as the routine you’re debugging. Your local machine runs the debugger’s UI while the remote system runs both the debug engine and the target routine.
Remote debugging is particularly useful for a few reasons:
- Controlling the flow of execution: It’s vital that developers understand the context of a bug as it manifests, and remote debugging affords that with features like pausing, resuming, and executing the program step by step.
- Debugging in production environments: Troubleshooting problems on remote testing and production servers is no easy task. Running a debugger directly on the server where the application is running comes with its own set of limitations. Production servers usually run in strict environments where convenient developer tools are absent. Remote debugging from a local IDE addresses this problem.
- Catering to multiple deployment scenarios: Developers can debug a variety of complex deployment scenarios, from a single, standalone application to distributed applications and clusters.
Java remote debugging in practice
Most programming languages support some kind of remote debugging with the right tooling in place. Java remote debugging is available in several flavors, including integrations with most IDEs.
In this tutorial, you’ll see how to set up Java remote debugging in IntelliJ IDEA so you can effectively debug applications deployed to staging and production machines when necessary.
(Note that we also have a tutorial on remote debugging in VS Code.)
Setting up Java remote debugging in IntelliJ IDEA
JetBrains’ IntelliJ IDEA is one of the most intelligent integrated development environments (IDEs), used by 62 percent Java developers. It offers developers powerful Java debugging features out of the box, including remote debugging.
You can always debug production applications in IntelliJ IDEA using Lightrun — just create a Lightrun account!
Creating a New Project and Class
The first step is to properly set up and configure your Java project in IntelliJ IDEA. If you have not set up a Java program before, read the IntelliJ IDEA documentation to understand how you can create and configure a new Java project.
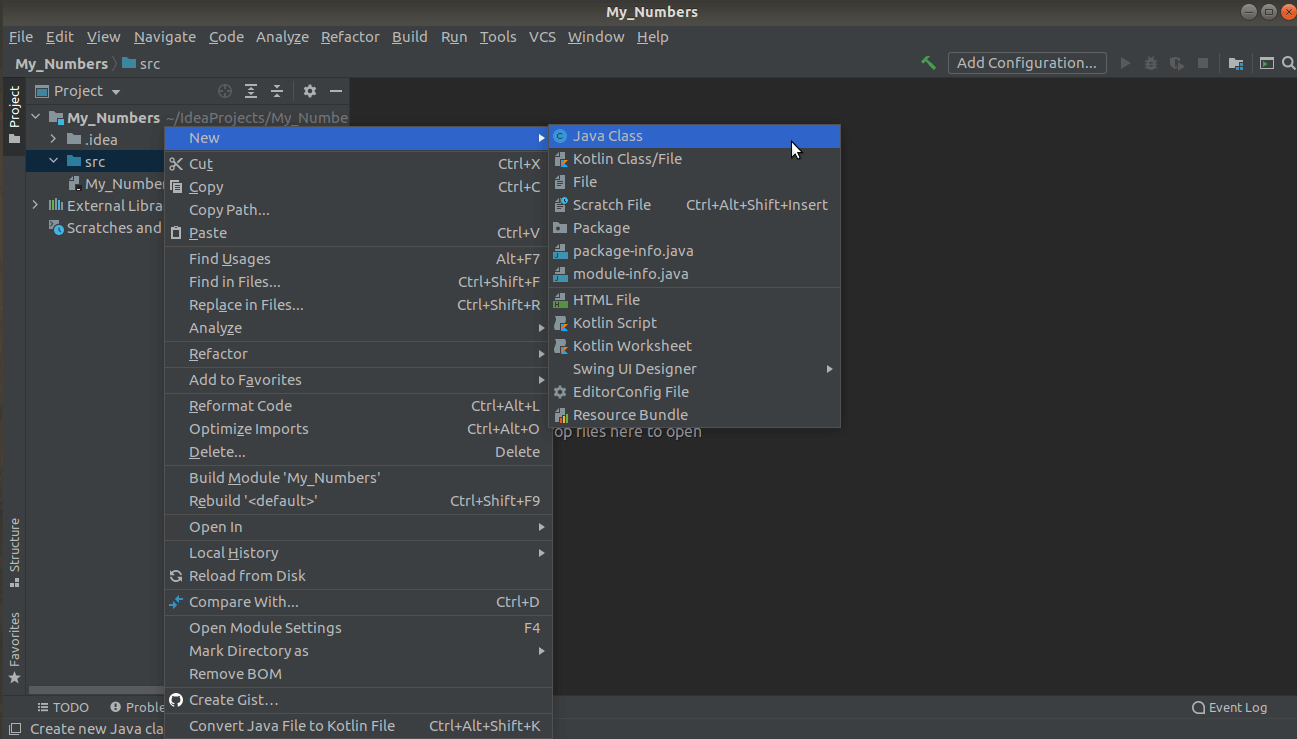
In order to demonstrate Java remote debugging in IntelliJ IDEA, create a new class. Click src in the Project view, hover on New, then click Java class. For this example, we’ll create a class named My_Numbers.
Once you have created the Java class, it’s time to write some code. Populate the Main method with the following code:
public class My_Numbers {
    public static void main(String[] args) {
        System.out.println("Initiating");
        for (int num = 0; num < 100; num++) {
            try {
                Thread.sleep(1000);
            } catch (InterruptedException e) {
                e.printStackTrace();
            }
            System.out.println(num);
        }
        System.out.println("Done");
    }
}
This code is a basic example that prints numbers from 0 to 100. While it’s a simple example, it will be enough to showcase Java remote debugging in IntelliJ IDEA without adding too much complexity. You’ll add and configure a debug breakpoint in later steps.
Configuring Remote Debugging in IntelliJ IDEA
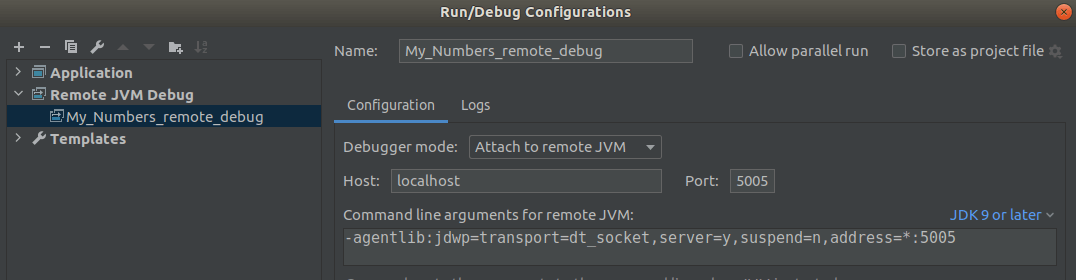
Now that you have a Java project and test class ready, you need to set up a Java remote debug configuration in IntelliJ IDEA. Navigate to Run, then click Edit Configurations. Click Add New Configuration (+) and choose Remote JVM Debug.
Fill in the following information to describe your remote debugging environment:
- Name: In this case,
My_Numbers_remote_debug. - Host: This field is for the address of the machine where the host app will run. Since we’re running on the same server in this example, it should be
localhost, but if you want to debug a remote server (eg,192.168.18.46), you must enter the IP address here. - Port:
5005in this case. This port should be available, so pick one that your server supports. - Command-line arguments: You can copy the generated command-line arguments and paste them to the command line where JVM is active. You can copy the string for now eg,
-agentlib:jdwp=transport=dt_socket,server=y,suspend=n,address=*:5005and store it for later use.
Now IntelliJ IDEA knows where to access your local or remote Java application for debugging, but you still need to package and run the Java app to enter a debugging session.
Running the Java application
Set up the host application by packaging your application as a JAR and use the previously generated argument string directly in the command line.
java -jar -agentlib:jdwp=transport=dt_socket,server=y,suspend=n,address=*:5005 remote-debug-application-sample.jar
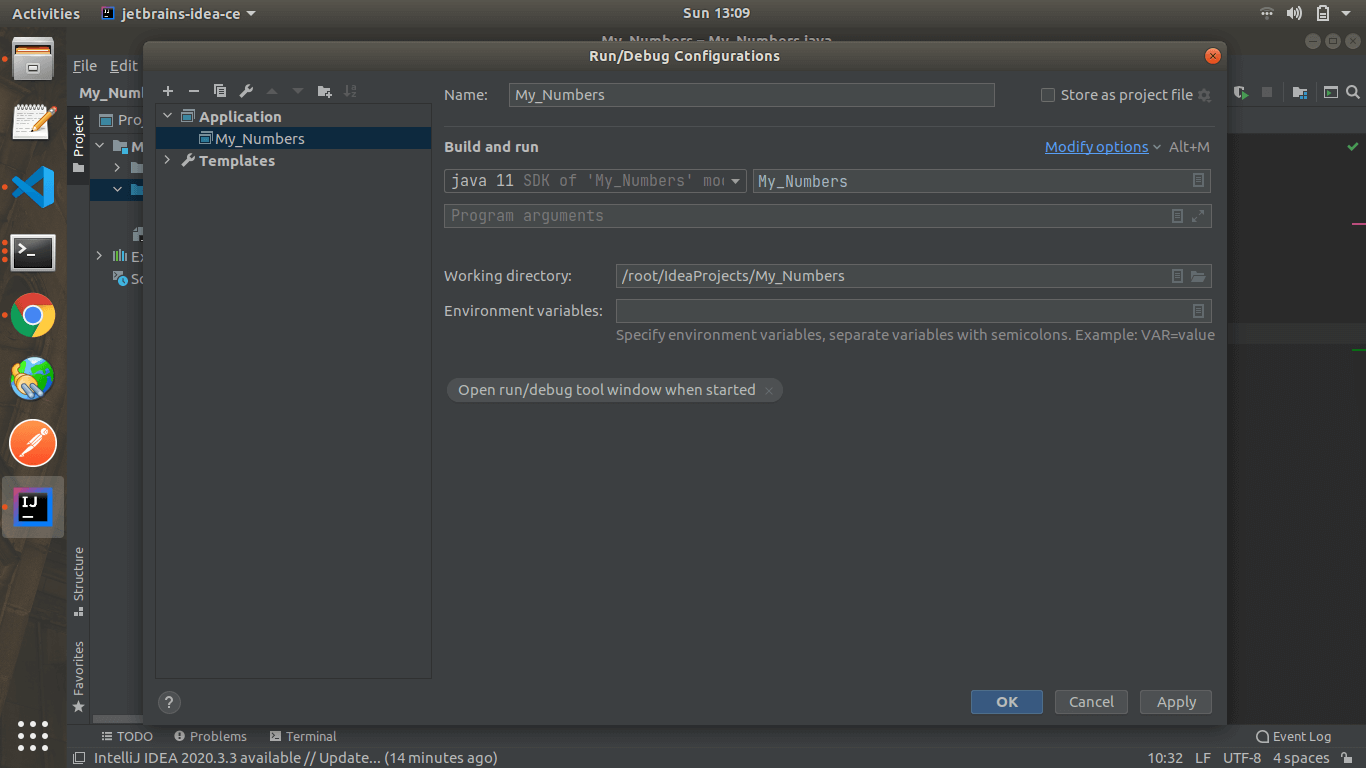
Next, click Run, then Edit Configuration, then select My_Numbers under Application.
In Modify Options, select Add VM options.
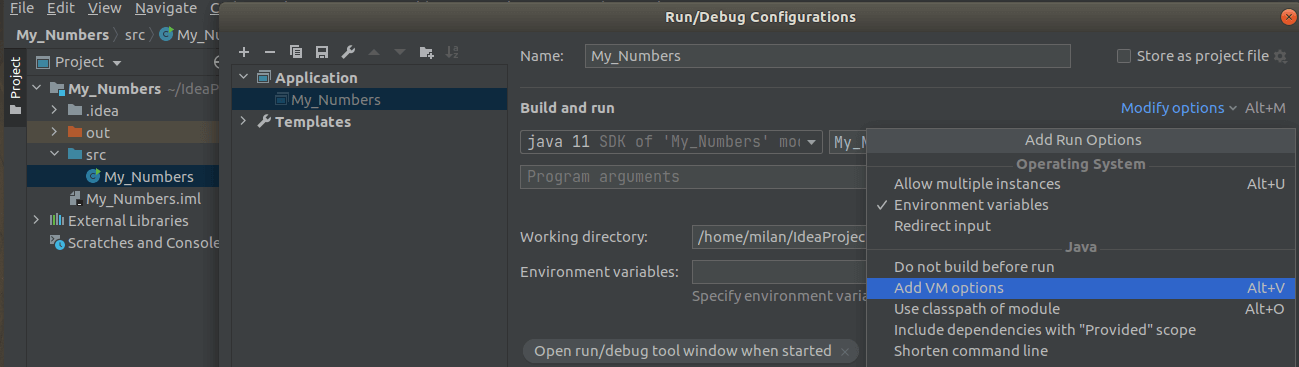
Under the VM options field, paste the argument string that you copied previously.
With the necessary setup in place, you are ready to run the Java application. Right-click in the text editor and click Run My_Numbers.main().
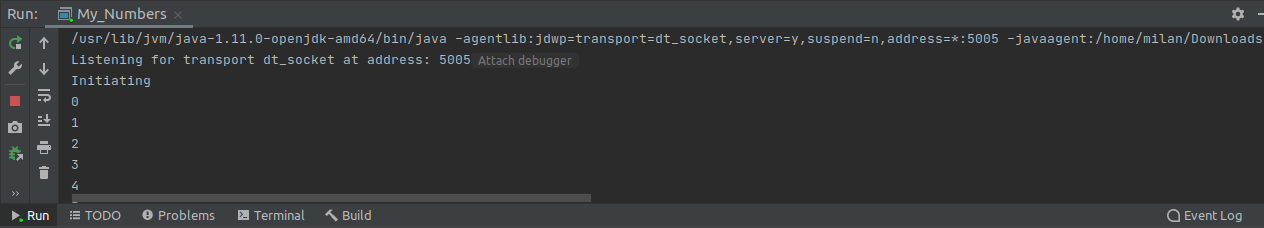
In the program output, you’ll see Listening for transport dt_socket at address: 5005, followed by your app’s output. The first line states that the debug agent is active and the program is ready to accept incoming debugger connections.
Adding a Breakpoint
Now that your Java program is running, you can add a breakpoint. Breakpoints allow you to set a place in the code where execution will pause so you can inspect memory, variables, and the state of your program. Breakpoints work the same whether you’re debugging locally or remotely in IntelliJ IDEA.
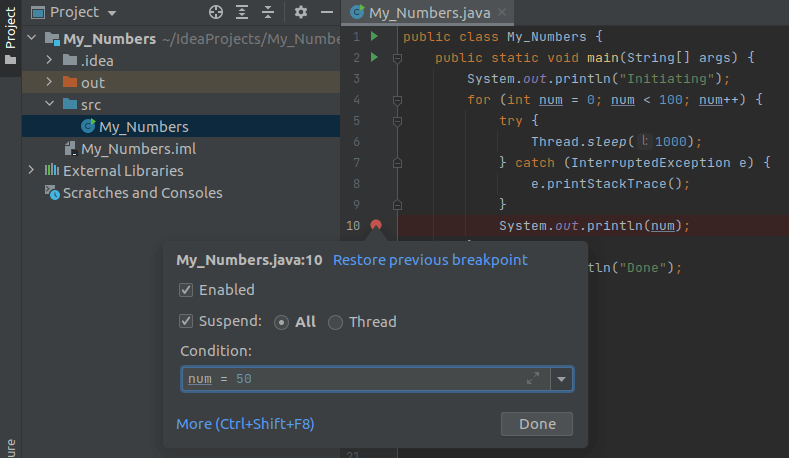
You can set a line breakpoint by clicking on the gutter at the line of your choice. For this example, click line 10 and set the breakpoint with the condition num = 50. The program will be suspended as soon as the breakpoint condition is met.
At this point, you can perform relevant debugging actions, including expression evaluation and stepping, among other tasks. These actions will work whether you’re running locally on your machine or debugging a remote Java application.
Is remote debugging in IntelliJ IDEA your best bet?
While remotely debugging Java applications with IntelliJ IDEA is possible, this approach has its drawbacks:
- Connecting IntelliJ’s debugger to a remote machine may expose that machine to security vulnerabilities.
- In order to correctly step through the code, you need to always make sure to sync the source code opened in your IDE with the version of the Java application being debugged.
- If your source code lacks proper logging, you may need to redeploy your Java application several times before you can finally make sense of the problem.
- Most importantly, when you’re debugging a remote Java application, stopping on any breakpoint will halt execution, which is something you want to avoid at all costs with a live production application serving hundreds or thousands of users.
If you want to avoid these drawbacks in your Java remote debugging scenario, take a look at Lightrun: our next-gen remote debugger for your production environment. With Lightrun, you can inject logs without changing code or redeploying, and add snapshots: breakpoints that don’t stop your production application. Lightrun supports Java, Python and Node.js applications, integrates with IntelliJ IDEA, and you can start using it today.