Effective Remote Debugging in PyCharm
Oct 03, 2023

In a previous post, we looked at the remote debugging features of Visual Studio Code and how Lightrun takes the remote debugging experience to the next level. This post will examine how Lightrun enables Python remote debugging in PyCharm, the Python IDE from JetBrains.
Remote Debugging in PyCharm
PyCharm has many developer-friendly features, including an integrated debugger. It also boasts several advanced debugging features not found in other IDEs.
Some of PyCharm’s key debugging features are:
- Better support for Python. Being a Python IDE, PyCharm is well-suited for Python applications, including multithreaded processes. Other IDEs require additional code or configuration to enable smooth debugging in advanced scenarios.
- Built-in profiler. PyCharm boasts a built-in profiler to help remove performance bottlenecks from your Python code.
- Remote debugging: PyCharm also supports remote debugging where you can attach to one process or several processes running in parallel.
Drawbacks of Remote Debugging in PyCharm
Although PyCharm provides rich features for Python development, its native support for remote debugging is fairly limited.
- Manual configuration. PyCharm’s remote debugging workflow requires setting up an SSH connection to a remote host and an additional run configuration to deploy the Python interpreter remotely.
- Source code pollution. If you want to use PyCharm for remote debugging, you need to install and import a separate Python package,
pydevd_pycharm. This means you introduce untracked temporary changes to your code, which isn’t a good practice. - Not suitable for production debugging. PyCharm’s debugger, whether local or remote, is suited for debugging applications in development and pre-production environments. Debugging a production application is not possible without making code and configuration alterations.
The native support for remote debugging in PyCharm is comparable to other debuggers such as that of VS Code. All these debuggers still rely on the traditional “Halt, Inspect, and Resume” approach.
There are two primary shortcomings of these debuggers:
- Debugging by controlling the runtime execution. These debuggers are designed to halt and resume the runtime execution. This technique cannot be utilized for production applications, which must always be running to serve the users.
- Attachment to long-running processes. Traditional debuggers were designed for monolithic applications, which execute as a long-running process. It does not work in a cloud-native environment with hundreds of ephemeral processes.
Therefore, the traditional debugging approaches supported by PyCharm and other IDEs are only suitable for long-running processes in a non-production environment. With the advent of cloud-native applications designed for the modern deployment model, these shortcomings become a clear bottleneck for developers to debug effectively.
Leveling up PyCharm Remote Debugging with Lightrun
Lightrun is a developer-centric continuous observability platform that integrates with most popular IDEs for Java, Node.js, and Python. In the case of PyCharm, it is available as a plugin.
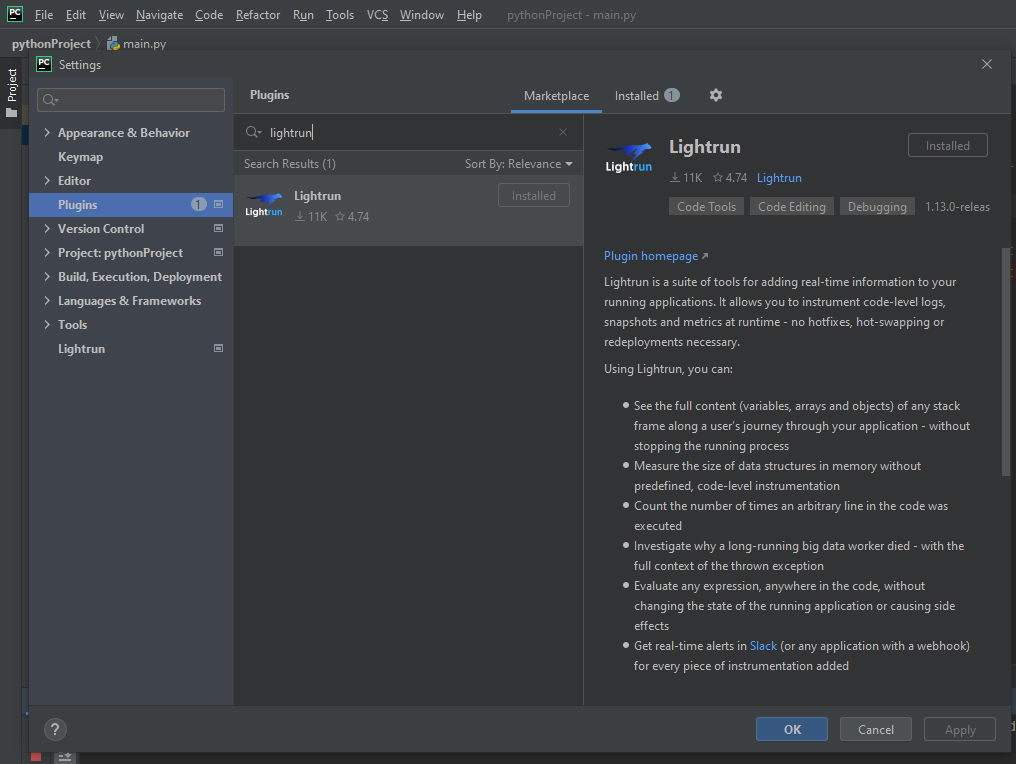
Lightrun extends PyCharm’s remote debugging capabilities in a few ways:
- Native IDE support for remote debugging. The Lightrun plugin integrates with PyCharm to offer all the visual controls for remote debugging. Developers have the option to connect to a remotely executing Python application on-the-fly and perform debugging right in the IDE. Lightrun handles the connections and setup for accessing the remote Python application in real time.
- Ready for cloud-native debugging. By embedding the Lightrun agent as a Python module within the Python applications, developers can control their production applications remotely and seamlessly perform debugging actions such as setting virtual breakpoints, extracting snapshots of the stack, and capturing metrics on multiple instances of a cloud-native Python application.
- Highly secure remote debugging. Lightrun’s security architecture ensures that remote debugging is performed in a sandboxed environment. It is a robust, patented mechanism that ensures that every debugging action performed on a production application is secured to ensure the privacy of the source code and no ill effects on the application’s performance.
PyCharm + Lightrun = Production Grade Remote Debugging
With Lightrun’s integration into PyCharm, developers get higher debugging productivity. Instead of spending hours logging the debugging data across the entire Python source code and analyzing it later, they can capture all the data in PyCharm.
For companies, Lightrun’s dynamic observability capabilities help efficiently detect and address security vulnerabilities in corporate software development. Overall, it leads to a faster time to market.
If you are keen to know more, you can try Lightrun yourself using the playground, or book a demo for a guided introduction.