Effective Remote Debugging with VS Code
Aug 14, 2023

This post will discuss remote debugging in VS Code and how to improve the remote debugging experience to maximize debugging productivity for developers.
Visual Studio Code, or VS Code, is one of the most popular IDEs. Within ten years of its initial release, VS Code has garnered the top spot among popularity indices, and its community is growing steadily. Developers love VS Code not only for its simplicity but also due to its rich ecosystem of extensions, including the support for debugging.
VS Code Remote Debugging Features
Being an integrated environment, VS Code has built-in support for debugging in many languages. Support for Node.js applications is available by default. This includes JavaScript, Typescript, and any other language that gets transpiled to JavaScript. Language extensions are also available for Python, C/C++, and most popular programming languages.
VS Code’s remote debugging features allow developers to debug a process running on a remote machine or device. This scenario is the opposite of local debugging, where the debugging is performed on a process spawned within VS Code’s integrated environment.
VS Code’s mechanism for debugging relies on attaching the debugger to a process, which is the executable program to be debugged. VS Code offers a custom launch configuration that allows many ways of attaching the debugger to a process. When debugging locally, the process executes inside VS Code’s environment, and the debugger is attached automatically. When you use VS Code for remote debugging, the launch configuration is updated with parameters for the debugger to point to a process running on a remote host via the IP address.
Some of the features of VS Code remote debugging are:
- Consistent debugging UI. In VS Code, the user interface for debugging remains unchanged irrespective of local or remote debugging.
- Custom launch configuration. VS Code launch configurations offer many options to set parameters for remote debugging. This mainly includes:
- Port forwarding to set up communication between the VS Code debugger and the process running on the remote computer.
- Source paths to point to the correct source code version associated with the running process.
- Environment variables to set additional variables to control the debugging session.
- Multi-target debugging. VS Code supports multi-target debugging, wherein developers can launch more than one debugging session pointing to different processes.
- Debugging controls. Remote debugging in VS Code provides the same debugging controls developers use in a local debugging environment. These include setting breakpoints, log points and controls for stepping through the code manually.
Additionally, it supports multiple debug protocol adapters for different languages like C++, Python, Go, etc., with the extensibility to build custom debugging adapters for other platforms.
The Paradigm Shift for Debugging
Despite all the rich debugging capabilities, the VS Code debugging interface has shortcomings. To understand these shortcomings, it is vital to know how classical debugging methodology evolved in software engineering.
The classical debugging workflow relies on three approaches:
- Halting the process execution. This is done using breakpoints to halt the runtime execution of the process at a certain point where the bug is most likely to reproduce.
- Examining of the stack trace. This is done while the process execution is halted to examine the variable values.
- Manual control of business logic. This is done to step through the execution of the process, one source code line at a time, and optionally substituting variable values to understand the system behavior precisely.
Given the advancements in software design and deployment models, this traditional approach to debugging, supported by integrated environments like VS Code, needs to catch up in many ways. This deficiency is due to a combination of paradigm shifts across multiple facets of software development: from desktop to cloud-hosted applications, from monoliths to microservices, and from legacy VMs to cloud-native deployments.
Disadvantages of Remote Debugging in VS Code
Given these sweeping paradigm shifts the industry has witnessed in the last few decades, VS Code’s local and remote debugging experience has the following disadvantages:
- Traditional debugging isn’t helpful in production environments. The classical debugging approach relies on halting and manual control of process execution, which is not an option for the production environment. With the advent of agile methodologies, developers spend more time fixing bugs in the project’s staging and production phases than in the development phase. Therefore, runtime observability and monitoring are gaining precedence over debugging.
- Debuggers were never designed for cloud-native applications. Cloud-native applications are distributed across multiple containers. While VS Code remote debugging supports containerized applications, they can only be used for long-running processes. In contrast, cloud-native deployment uses multiple ephemeral containers, which cannot be managed through the VS Code debugger interface. Also, the traditional debugging approach does not help unearth hard-to-find bugs that occur due to data races or deadlocks common in complex cloud-native applications running across hundreds of containers.
- Manipulating the control flow is less relevant in this age of AI. Artificial Intelligence based applications rely on complex data models to make decisions instead of hand-coded control flow logic. VS Code debugger interface cannot debug such processes since it requires a different level of observability and analysis beyond just manipulating the business logic.
- Security issues in remote debugging. Facilitating remote debugging also exposes specific ports on the remote computer where the process runs. Even though VS Code supports SSH based connections for secured access, there are no additional measures to impose IAM (Identity & Access Management) like permissions. This situation can result in debug enabled applications running in production where credentials are shared between development teams, leading to a potential security breach in the future.
Enhanced Remote Debugging in VS Code with Lightrun
Lightrun breaks the stereotype of classical debugging and enables debugging any application on any deployment.
The core approach for Lightrun revolves around developer observability, which allows developers to observe the internal behavior of an application at runtime. It surpasses the drawbacks of traditional debugging in the following ways:
- Designed for remote debugging in the cloud. All modern, cloud-hosted applications are offered through the “as a service” model, which requires them to be constantly running and available to serve the end user. Lightrun facilitates remote debugging of production applications running on cloud environments without custom configurations or manipulation in process runtime. This includes the popular deployment orchestration platforms such as Kubernetes.
- Designed for instant observability. Lightrun can capture live logs and instant snapshots of the running application, offering instant observability. The snapshots act like virtual breakpoints, which provide information about stack traces and variables without pausing the program execution.
- Designed for debugging entire applications instead of individual processes. Rather than attaching to every process instance, the Lightrun agent gets embedded within all the runtime workloads of the application. All the logs and snapshots collected from the multiple runtime process instances can be collated in one place for easier investigation of bugs.
Transcend from Remote Debugging to Live Debugging in VS Code
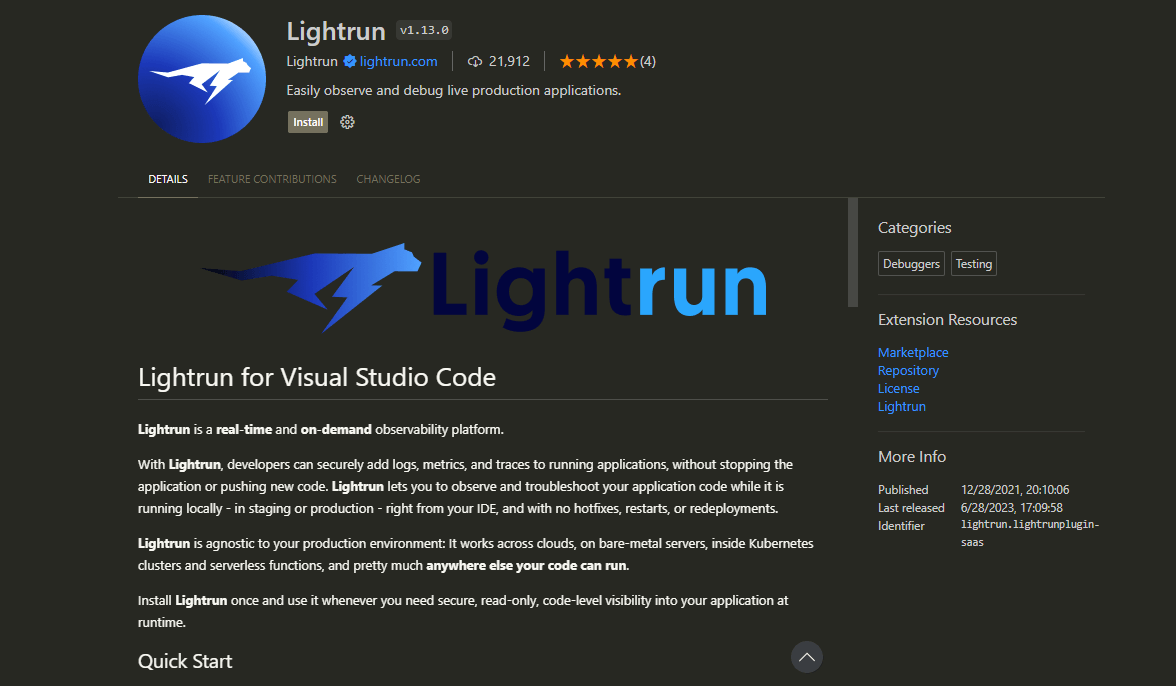
The best part about Lightrun is that it is available as a VS Code extension:
Developers take advantage of a familiar interface to perform live debugging actions, right in VS Code:
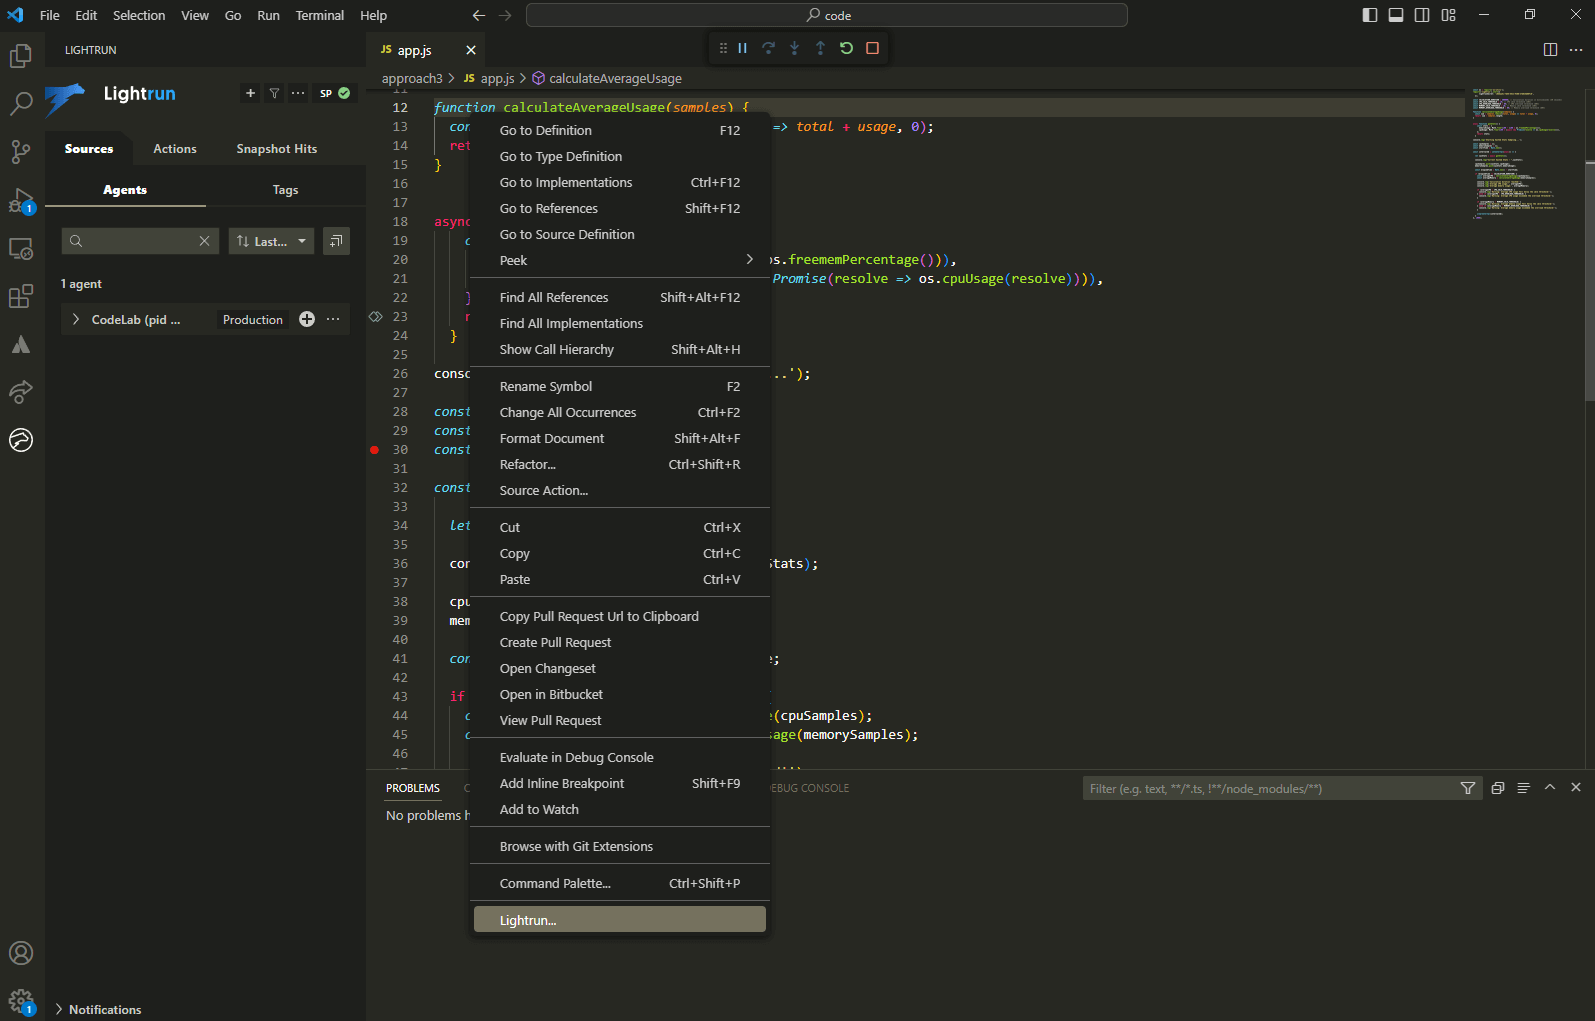
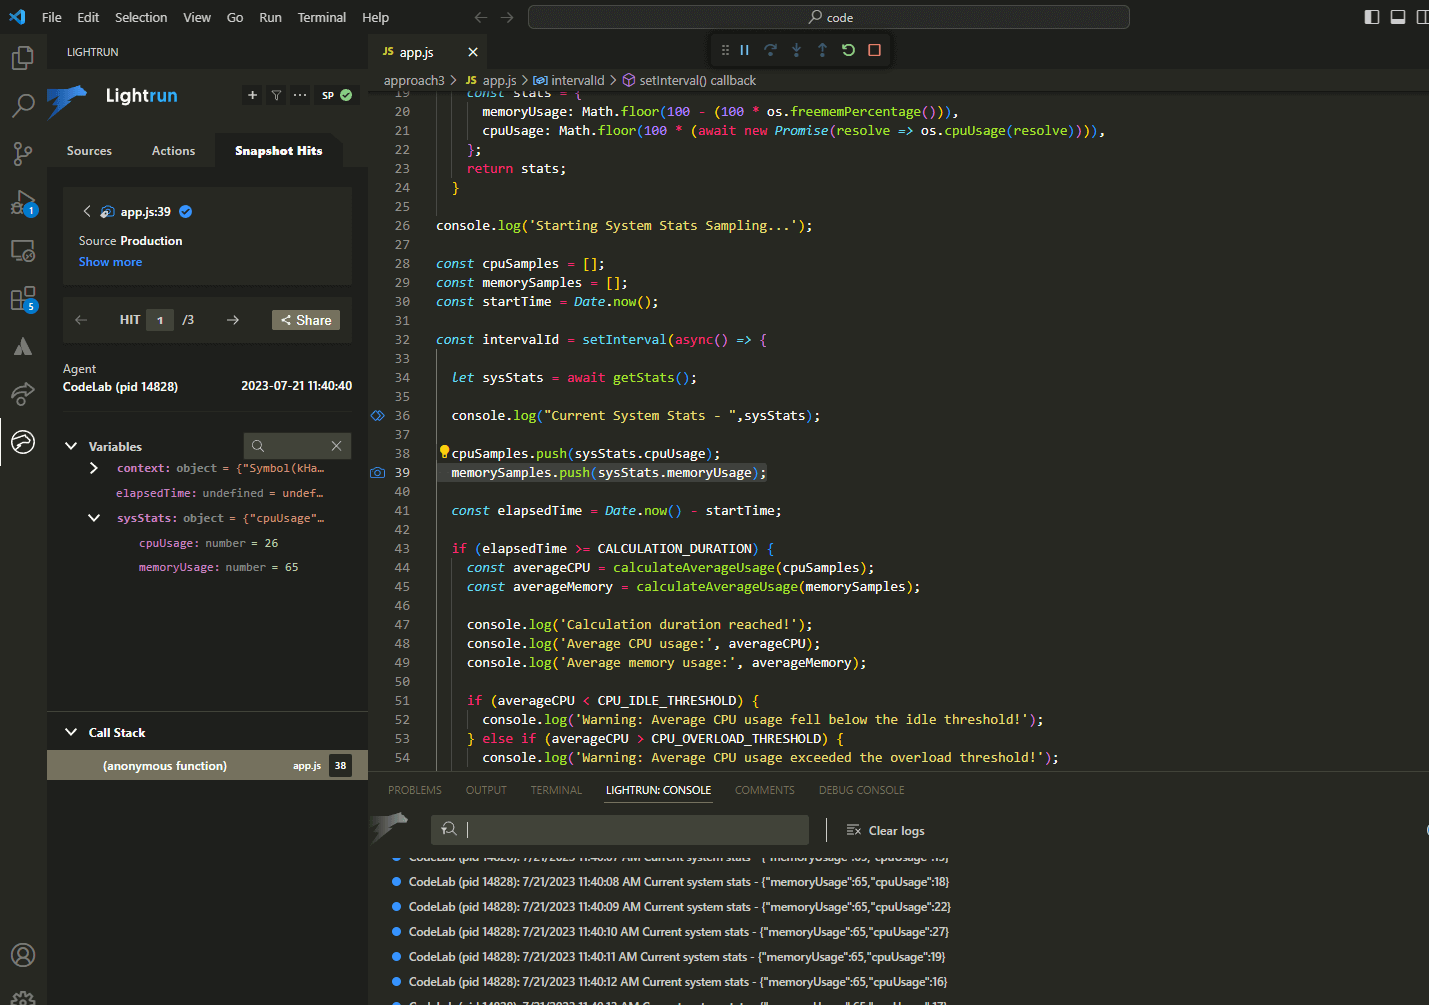
While debugging, Lightrun panel views inside VS Code display logs and detailed snapshot information related to running application:
Behind the scenes, the Lightrun VS Code plugin connects to Lightrun agents embedded within the application to make all the live debugging magic happen.
If you are keen to explore Lightrun integration with VS Code further, check out the Lightrun documentation.
You can also sign up for a Lightrun account and get started with live debugging of Node.js, Java, Python, or .NET applications.