
Full-cycle observability with the Elastic Stack and Lightrun
An application running in production is a difficult beast to tame.
Most experienced developers–ones who spent enough late nights or Saturday mornings trying to break apart a nasty production bug–will try and create the clearest possible picture for their later selves while writing their code, so that they could understand what’s actually going on in the system during an incident.
To make life easier, developers can use a combination of a robust observability stack to collect, transform and view logs application-wide, paired with a real-time observability platform that can augment the log stream without pushing new code, re-deploying, or even restarting the service. That’s how Elastic and Lightrun can tame that beast together.
Logging is a hard problem
While writing logs is relatively easy, consuming them is a whole different ball game:
- Logs are inconsistently formatted – Most modern software is a spider’s web of many different open-source projects, third-party dependencies and internal packages. All of these pieces log according to different methodologies and in ever-so-slightly different formats.
- The information being logged is inconsistent – Since most of these components are written by different developers working according to different logging styles (or none at all), the actual value that can be derived from the logs varies considerably.
-
- Log files are spread out across each specific host – Logs are often not easily available from a single file, but rather spread out across multiple files in different places in the filesystem. Log splitting and rotation – the practice of chunking logs into small files that are overwritten over time – also causes frustration when trying to locate a specific log line that was captured a while back.
- Logs are spread out across multiple hosts – Our applications are not single beings – they’re spread out across multiple instances, orchestrated in Kubernetes clusters and packaged into containers. Figuring out where in the application’s topology a specific piece of information is can also be tricky.
- Logs are expensive to store – Persisting logs over time on disk, especially as deploying more and more software gets easier, means a ton of space consumed for the sole purpose of storing log files – which can get expensive, fast.
- Logs are expensive to analyze – Parsing enormous amounts of information is a time and resource-consuming task.
This, of course, doesn’t stop developers from logging; to the contrary – the absolute explosion of complexity in modern software only encourages us to log more, so we can be absolutely sure that we’ll have that exact piece of information we need later on.
Let’s take a look at a real-life example and learn how Elastic can help.
The Elastic Stack – ship, store and analyze your logs in a central location
The Spring ecosystem has a very well-known sample application called the Spring PetClinic. It is a great example of a relatively simple web application built around the popular Spring Boot – a pet clinic management system, that enables veterinarians to track the pets they treat, record information about their owners and manage appointments.
Let’s see how to use Elastic to get a better view of the application’s logs. We’ll start by downloading and running the application – open a terminal window and clone the repository:
git clone https://github.com/spring-projects/spring-petclinic.git
cd spring-petclinic
Use the Maven Wrapper in the folder to package and then run the application:
./mvnw package
java -jar target/*.jar
Once the JVM spins up, you’ll be able to see the application logs streaming into your terminal window:
2021-06-27 21:30:45,601 INFO  [main] org.springframework.boot.StartupInfoLogger: Starting PetClinicApplication v2.4.5 using Java 11.0.11 on lightrun-Ubuntu with PID 879947 (/home/lightrun/Workspace/spring-petclinic/target/spring-petclinic-2.4.5.jar started by itai in /home/lightrun/Workspace/spring-petclinic)
2021-06-27 21:30:45,604 INFO  [main] org.springframework.boot.SpringApplication: No active profile set, falling back to default profiles: default
2021-06-27 21:30:47,789 INFO  [main] org.springframework.data.repository.config.RepositoryConfigurationDelegate: Bootstrapping Spring Data JPA repositories in DEFAULT mode.
…
…
…
Recall that in order to see these logs in a production setting, you will be required to connect to the remote production machine and either tail a log file continuously, or keep the application’s process in the foreground of the terminal.
The application comes pre-populated with many log lines – ones that come from Spring itself, from the ORM layer, from the application logic and so forth. Naturally, we expect the amount of logs to grow further as we add more and more functionality to the app, and filtering through the log files through the terminal might become cumbersome very fast.
In order to make things easier for everyone involved (and prevent developers from randomly connecting to production machines to scoop log data) we’re going to integrate our application with Elastic.
Integrating your Java application with Elastic is quite straightforward:
1. Create an Elastic account
2. Add the following dependencies to your pom.xml (we’re adding Logback, a popular logging framework for Java, and the appropriate ECS – Elastic Common Schema – encoder for Logback)
<dependency>
    <groupId>ch.qos.logback</groupId>
    <artifactId>logback-classic</artifactId>
    <version>1.2.3</version>
</dependency>

<dependency>
    <groupId>ch.qos.logback</groupId>
    <artifactId>logback-core</artifactId>
    <version>1.2.3</version>
</dependency>

<dependency>
    <groupId>co.elastic.logging</groupId>
    <artifactId>logback-ecs-encoder</artifactId>
    <version>1.0.1</version>
</dependency>
3. Add our logger to the application:
public class PetClinicApplication {
    public static void main(String[] args) {
        Logger logger = LoggerFactory.getLogger(PetClinicApplication.class);
        SpringApplication.run(PetClinicApplication.class, args);
        logger.info("PetClinic has started");
    }
}
4. Configure the application to work with logback, add the following lines to ‘<pet_clinic_dir>/src/main/resources/application.properties’:
logging.config=classpath:logback-spring.xml
spring.application.name=lightrun-application
logging.file.name=<pet_clinic_dir>/my-application.log
5. We’d also need a small configuration file to integrate Logback with Spring. Create a new file named ‘logback-spring.xml’ under the ‘<pet_clinic_dir>/src/main/resources/’ folder and paste in the following content:
<?xml version="1.0" encoding="UTF-8"?>
<configuration>
    <property name="LOG_FILE" value="${LOG_FILE:-${LOG_PATH:-${LOG_TEMP:-${java.io.tmpdir:-/tmp}}}/spring.log}"/>
    <include resource="org/springframework/boot/logging/logback/defaults.xml"/>
    <include resource="org/springframework/boot/logging/logback/console-appender.xml" />
    <include resource="org/springframework/boot/logging/logback/file-appender.xml" />
    <include resource="co/elastic/logging/logback/boot/ecs-file-appender.xml" />
    <root level="INFO">
        <appender-ref ref="CONSOLE"/>
        <appender-ref ref="ECS_JSON_FILE"/>
        <appender-ref ref="FILE"/>
    </root>
</configuration>
6. The application is almost fully configured! All that’s left to do now is to collect the logs and send them to Elastic.
Filebeat is a log shipper, and an important part of the Elastic Stack. It takes care of taking the logs your application emits and getting them over the wire to Elastic. To configure Filebeat for your application you can:
a. Install Filebeat as instructed here (note that it is a local service running on your machine which is independent of the application)
b. Once Filebeat has been installed, add the following section to its configuration file (can be found in ‘/etc/filebeat/filebeat.yml’). This will make sure Filebeat is aware of the application, collects the logs it outputs and ships them to Elastic:
filebeat.inputs:
- type: log
 paths: <pet_clinic_dir>/my-application.log
 json.keys_under_root: true
 json.overwrite_keys: true
 json.add_error_key: true
 json.expand_keys: true

# Both cloud.id & cloud.auth can be found in Elastic
cloud.id: "<user_id>:<token>"
cloud.auth: "<user_id>:<token>"
c. Start Filebeat by running:
sudo service filebeat startThat’s it!
You can now run the application and the logs will flow directly to Elastic Observability’s log analysis pane:
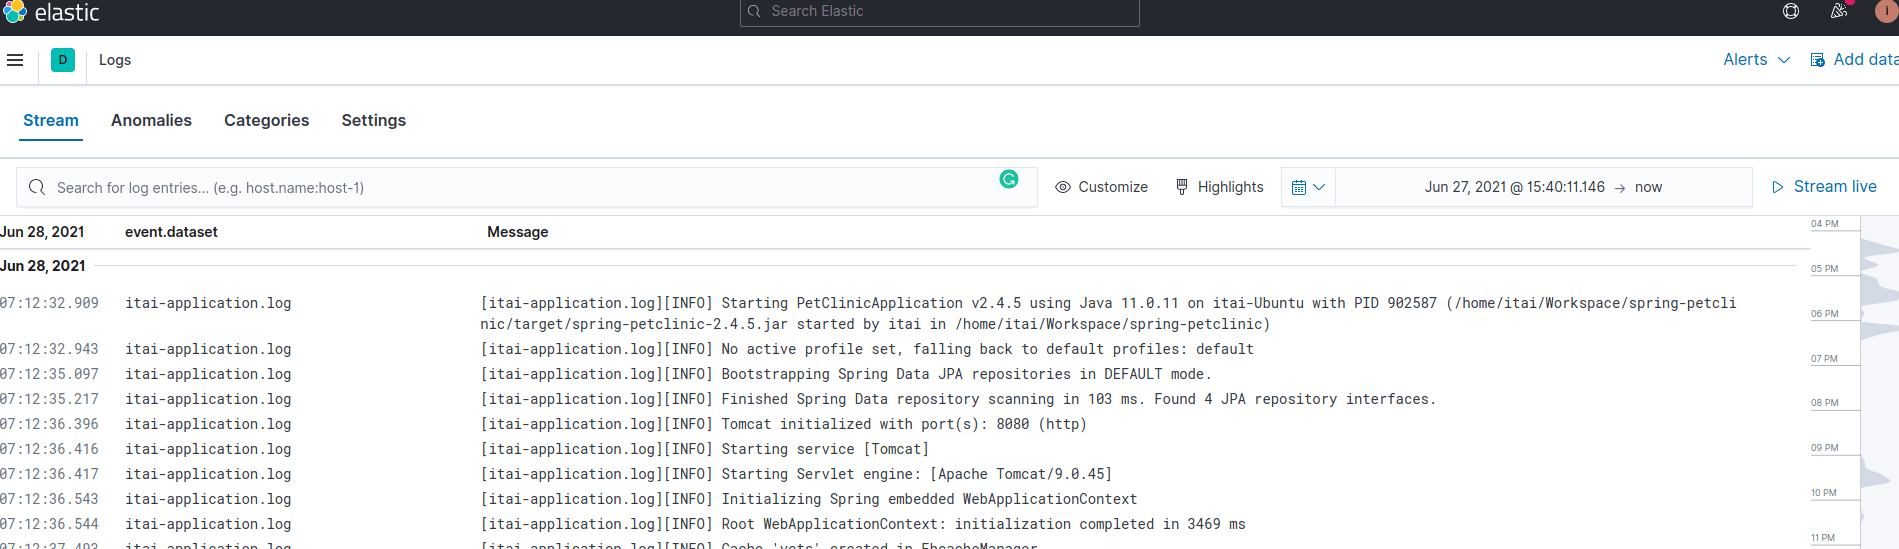
When all is said and done…
This would be an excellent place to end the article. We’ve got a bunch of infrastructure all queued up and ready to ship our logs over to a centralised platform, where we can slice and dice the information to extract anything we’d like from the existing logs.
Unfortunately, we can never actually log everything. There is always a variable we did not include in a log line, a property we’re missing in some data structure, a metric we forgot to instrument… Developing software is, after all, done by humans – not machines – and therefore is still prone to human error and constrained by the amount of things we actually end up logging.
Our applications, as history tells us, are full of these unknown unknowns – things we did not account for because we did not know they might happen. This is the nature of fast-changing, complex applications: they push boundaries, and as such can catch the team that owns them by surprise from time to time.
Let’s take a look at what we can do about it – using Lightrun.
Lightrun – add new logs in real-time and on-demand, without re-deploying or stopping the running application
The Blindspot
Let’s get back to PetClinic. Assume that some time has passed since the initial development of the application – we’ve added some more features, added some more logs to better understand these features in production and it all works great.
Or… does it? Let’s take a look at the following example, that depicts a fairly common occurrence. It’s obviously just an example – and a simple one at that – but it’s a great way to show how a simple misstep can catch us unprepared when things take a turn for the worse.
Let’s say our application turned bigger and bigger and we now need to track the number of owners – i.e. people who own pets – in the system. Our basic assumptions are that:
- The number will be used extensively
- The database has already become too busy as is
Given these two factors, we decided we’d like to keep this number in the cache. To do so, let’s first add a counter named ‘numberOfOwners’ to ‘OwnerController.java’.
private int numberOfOwners = 10;Now, each time we save a new owner to the repository, we want to increase that number to account for the change – let’s add some code to do so:
public String processCreationForm(@Valid Owner owner, BindingResult result) {
        if (result.hasErrors()) {
            return VIEWS_OWNER_CREATE_OR_UPDATE_FORM;
        }
        else {
            this.owners.save(owner);
            numberOfOwners++;
            return "redirect:/owners/" + owner.getId();
        }
    }
One thing worth mentioning in this context is that, currently, the application does not support owner removal. No owner has ever left the clinic and moved to another one – why would we need to implement logic to account for this occurrence? In order to future-proof our application? Nonsense! (We’re obviously being sarcastic here, if this is not apparent yet 🙂 )
Obviously, introducing the owner removal will be done in a different commit some time in the future. It can easily be done by a different developer than the one who added the ‘numberOfOwners’.
In addition, our application would have probably already expanded greatly, with OwnerController.java’ becoming significantly larger and more complicated.
Having said all that, it’s very common to forget to decrease ‘numberOfOwners’ once the owner removal code is introduced.
It might look something like this:
public String processRemovalForm(@Valid Owner owner, BindingResult result) {
        if (result.hasErrors()) {
            return VIEWS_OWNER_REMOVE_FORM;
        }
        else {
            this.owners.deleteById(owner);
            // Note what’s missing here?
            return "redirect:/owners”;
        }
    }
We now have a bug on our hands – a counter that represents the owners will never be decreased and will just keep on increasing.
This will cause inconsistency with other members and certainly with the database, with us never actually being aware that the root cause is a blatant programming error. In addition, this is not likely to throw an exception or cause an error anywhere in the system, unless a specific test was written to check for this very occurrence.
Another important fact, that makes it even harder to spot, is that – as we mentioned before – owner removal is not something that is widely used. The difference between the actual number of owners and the counter might not be that large, but it is going to be there – confusing the users of the system and causing some on-call developer to have a really bad night.
Once more, this is a very simple but important example. It shows how easily one can miss a bug and get lost while trying to figure out exactly what happened.
What can we do about this situation?
Lightrun + Elastic – 100% code-level, line by line observability
We need more power – Introducing Lightrun
To continue in our journey, let’s assume that some time has passed and we’ve now added two important features; one is the owner counter and the other is the owner removal support.
This version was released to production and its behavior is somehow different than expected. This is of course due to the counter not being implemented correctly, and finding the root cause might prove to be quite a hassle.
Remember that the counter is a piece of code-level information, saved in the application memory alone, and only available inside the current context. Traditionally, getting the value of that counter would require:
- Adding a log line in the appropriate place
- Committing & pushing the change to a remote repository, like GitHub
- Waiting for the CI/CD pipeline to finish, and for the release to roll
- Filtering for that information in Elastic
What if we could examine the code running in production while it’s running? What if we could take a peek at the current variable values while the bug is actually happening?
In this case, you should consider using Lightrun – a real-time observability platform that allows you to request – and immediately receive – any type of code-level information. Think variable values, sizes of arrays, and expression evaluation results.
Let’s see how it works in practice.
Setting up Lightrun
Integrating with Lightrun is simple:
- Create a Lightrun account
- Follow the instructions in the web interface to install Lightrun’s IDE plugin
- After the plugin has been installed, log into it by clicking the “Login” button from the plugin sidebar
- Once you’re logged in, go back to the web interface and download Lightrun’s agent into the PetClinic directory
- In Lightrun’s agent directory (should be located at <pet_clinic_dir>/agent) you’ll find a configuration file named ‘agent.config’.
For Lightrun to work with Elastic, we’d need to first convert all Lightrun logs to JSON. To do so, change the following line:
com.lightrun.DynamicLog.FileHandler.formatter=noneto, instead, read:
com.lightrun.DynamicLog.FileHandler.formatter=json - Now we need to tell Filebeat to collect Lightrun’s logs too. In ‘/etc/filebeat/filebeat.yml’ add a new input:
# under filebeat.inputs: - type: log paths: /tmp/lightrun_file_handler_logs*.log json.message_key: message json.keys_under_root: true - All that’s left to do now is spin up Lightrun’s agent alongside the PetClinic process when it starts:
java -agentpath:./agent/lightrun_agent.so -jar target/*.jar
That’s it, Lightrun is connected! The agent now is ready to receive requests. In order to actually add the log line we wanted to get the variable value, we’d need to install a Lightrun client – the most popular of which is the Lightrun IDE Plugin.
The Lightrun Plugin – Observability right in your IDE
The core component of the Lightrun experience is our IDE plugin:
Using the plugin (it’s available from the JetBrains Marketplace), you can now add:
- Lightrun Logs – Real-time logs where no logs existed before (which allow you to enrich the current log stream with code-level information).
- Lightrun Snapshots – “Virtual breakpoints” in the running application (which allow you to see the values of variables and entire data structures in memory without stopping the application).
- Lightrun Metrics – A set of quantitative metrics that allow you to measure the amount of time it took any arbitrary piece of code to run, count the amount of times any arbitrary line in the code was executed and see the change in any numerical variable (or expression evaluation) value over time.
Let’s see how all that fits nicely together with our own application.
Adding a Lightrun Log to our PetClinic application – While it’s still running
Once we’ve got the agent running and the plugin logged in, we’ll be able to see our agent in the Lightrun web console (navigate to Entities → Agents to see for yourself).
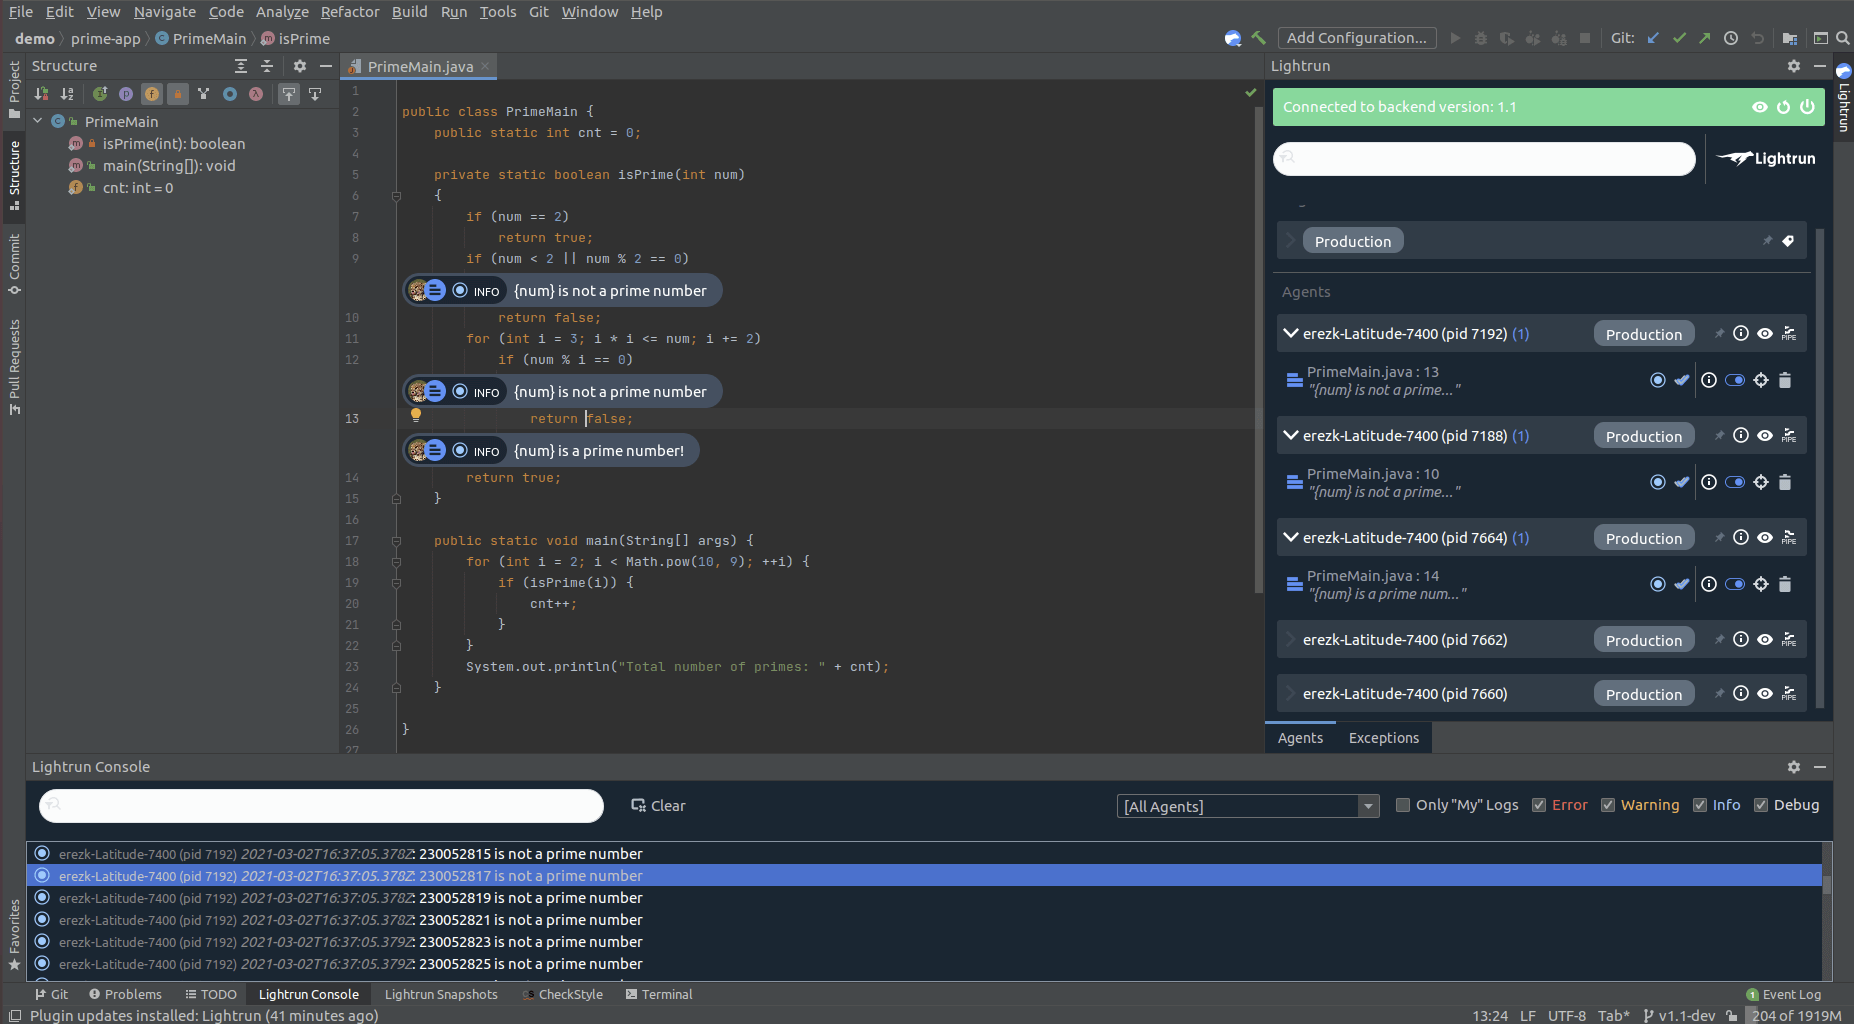
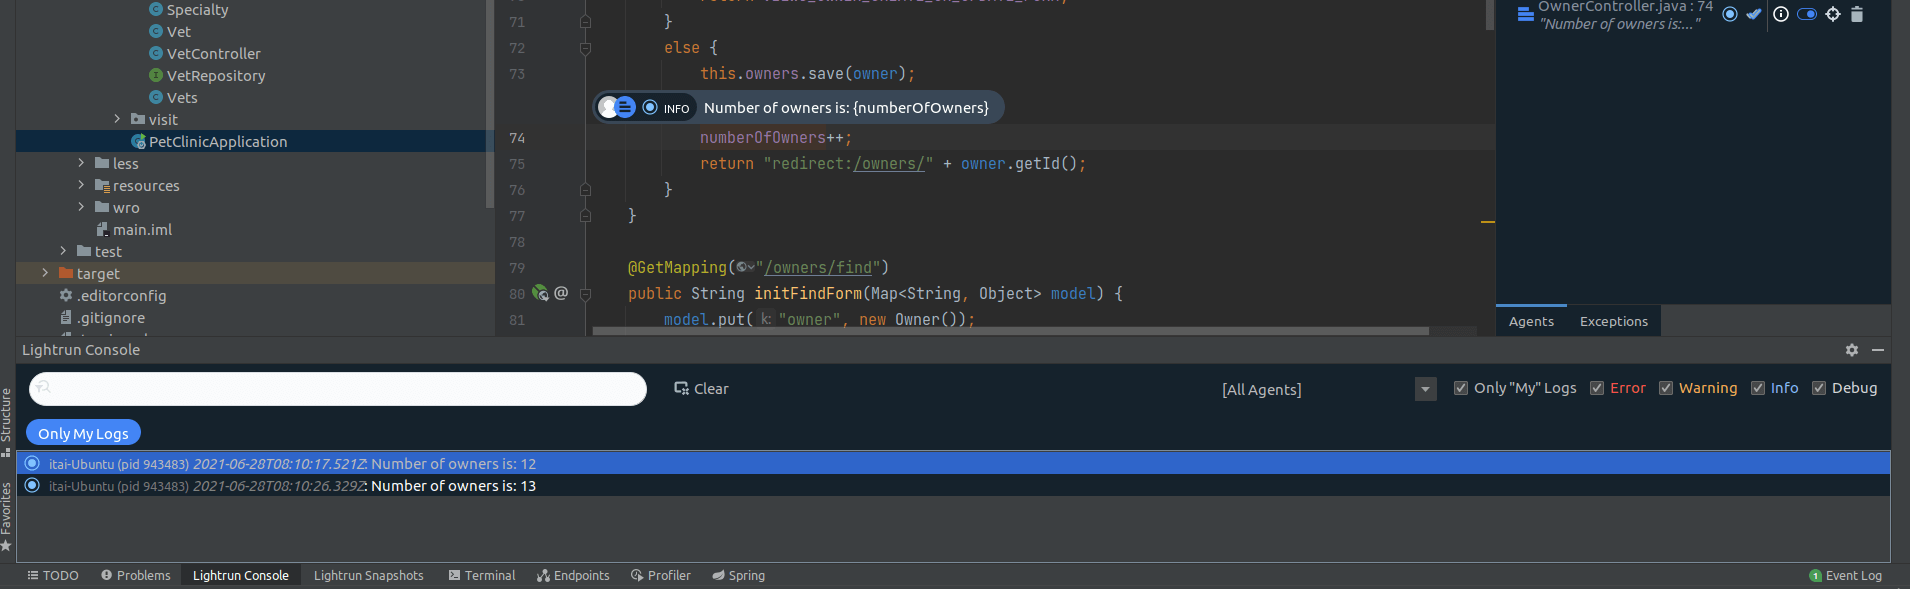
To add a Lightrun Log, you can use the IDE plugin by loading the relevant file to your IDE, right-clicking the line you want to add the log line to, and setting the format to the correct string (that includes the variable value):
From that moment on, each time the application will get through this line in an execution flow, a Lightrun Log will be sent to Elastic to be aggregated with all the other PetClinic logs:
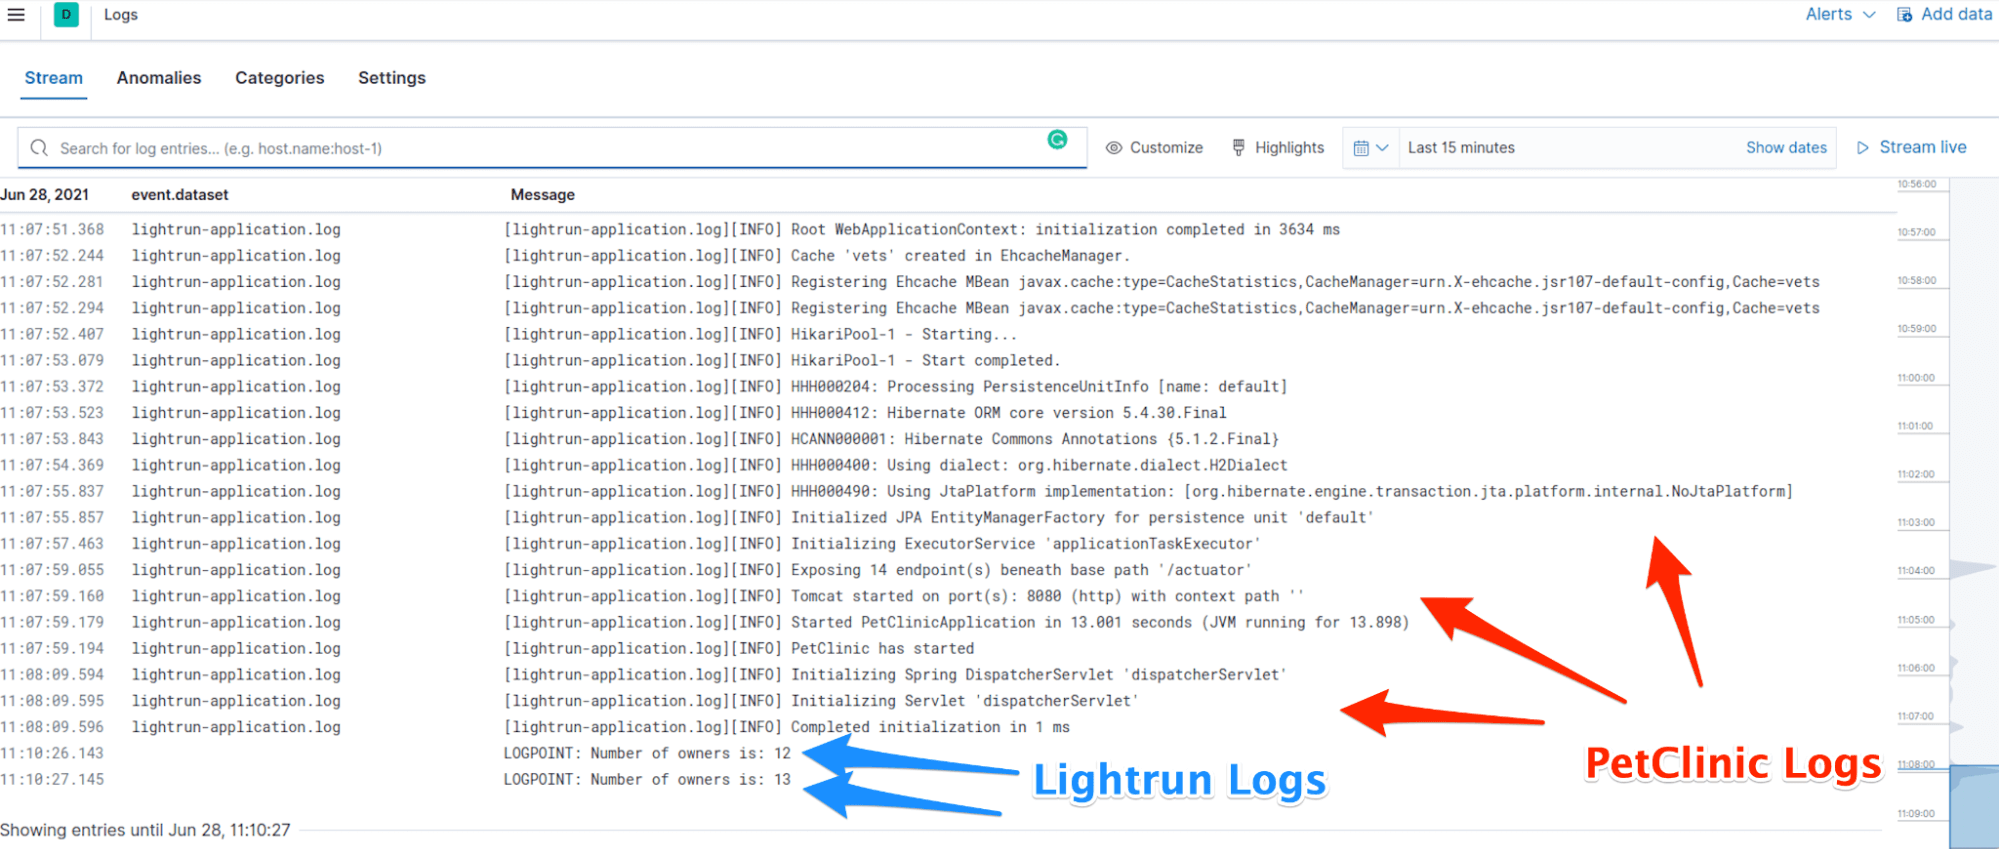
To give a bit more context into what’s actually happening under the hood, this is how the _source of both types of logs looks like (this is taken from the Elastic Dev Tools Console):
Original Application Logs
"_source" : {
      "@timestamp" : "2021-06-27T14:03:19.100Z",
      "ecs" : {
        "version" : "1.2.0"
      },
      "service" : {
        "name" : "itai-application"
      },
      "event" : {
        "dataset" : "itai-application.log"
      },
      "host" : {
        "ip" : [
          "192.168.1.40",
          "fe80::760c:a7b3:da95:d82e",
          "172.17.0.1",
          "fe80::42:deff:fecd:ec39",
          "172.19.0.1",
          "172.20.0.1",
          "172.27.0.1",
          "172.28.0.1",
          "172.18.0.1",
          "fe80::42:20ff:feaa:a45"
        ],
        "mac" : [
          "c0:3c:59:10:5b:99",
          "02:42:de:cd:ec:39",
          "02:42:46:d5:81:17",
          "02:42:4c:ea:af:4d",
          "02:42:23:a7:1d:3e",
          "02:42:88:1e:8d:81",
          "02:42:20:aa:0a:45",
          "74:78:27:b5:53:b9"
        ],
        "hostname" : "itai-Ubuntu",
        "architecture" : "x86_64",
        "os" : {
          "version" : "20.04.2 LTS (Focal Fossa)",
          "family" : "debian",
          "name" : "Ubuntu",
          "kernel" : "5.8.0-55-generic",
          "codename" : "focal",
          "type" : "linux",
          "platform" : "ubuntu"
        },
        "id" : "46fe355c51684ee78bb1bbc1e7941be5",
        "name" : "itai-Ubuntu",
        "containerized" : false
      },
      "container" : {
        "id" : "my-application.log.json"
      },
      "process" : {
        "thread" : {
          "name" : "main"
        }
      },
      "log" : {
        "offset" : 7770,
        "file" : {
          "path" : "/home/itai/Workspace/spring-petclinic/my-application.log.json"
        },
        "logger" : "org.springframework.samples.petclinic.PetClinicApplication",
        "level" : "INFO"
      },
      "agent" : {
        "id" : "74a70c22-0ae7-42cb-ba9d-04c7001dc88d",
        "name" : "itai-Ubuntu",
        "type" : "filebeat",
        "version" : "7.13.2",
        "hostname" : "itai-Ubuntu",
        "ephemeral_id" : "c3182767-6f93-46ae-b1ac-55e462c18a1d"
      },
      "message" : "Started PetClinicApplication in 5.81 seconds (JVM running for 6.27)",
      "input" : {
        "type" : "log"
      }
Real-time Lightrun Logs
"_source" : {
         "@timestamp" : "2021-06-28T08:10:27.145Z",
         "agent" : {
           "version" : "7.13.2",
           "hostname" : "itai-Ubuntu",
           "ephemeral_id" : "c3182767-6f93-46ae-b1ac-55e462c18a1d",
           "id" : "74a70c22-0ae7-42cb-ba9d-04c7001dc88d",
           "name" : "itai-Ubuntu",
           "type" : "filebeat"
         },
         "ecs" : {
           "version" : "1.8.0"
         },
         "class" : "org.springframework.samples.petclinic.owner.OwnerController",
         "method" : "processCreationForm",
         "log" : {
           "offset" : 246,
           "file" : {
             "path" : "/tmp/lightrun_file_handler_logs1.log"
           }
         },
         "thread_name" : "http-nio-8080-exec-9",
         "message" : "LOGPOINT: Number of owners is: 13",
         "level" : "INFO",
         "input" : {
           "type" : "log"
         },
         "host" : {
           "containerized" : false,
           "ip" : [
             "172.17.0.1",
             "fe80::42:deff:fecd:ec39",
             "172.19.0.1",
             "172.20.0.1",
             "172.27.0.1",
             "172.28.0.1",
             "172.18.0.1",
             "fe80::42:20ff:feaa:a45",
             "192.168.1.20",
             "fe80::8cdc:41ee:67dc:dff3"
           ],
           "name" : "itai-Ubuntu",
           "mac" : [
             "c0:3c:59:10:5b:99",
             "02:42:de:cd:ec:39",
             "02:42:46:d5:81:17",
             "02:42:4c:ea:af:4d",
             "02:42:23:a7:1d:3e",
             "02:42:88:1e:8d:81",
             "02:42:20:aa:0a:45",
             "bc:0f:9a:2b:27:f6"
           ],
           "hostname" : "itai-Ubuntu",
           "architecture" : "x86_64",
           "os" : {
             "codename" : "focal",
             "type" : "linux",
             "platform" : "ubuntu",
             "version" : "20.04.2 LTS (Focal Fossa)",
             "family" : "debian",
             "name" : "Ubuntu",
             "kernel" : "5.8.0-55-generic"
           },
           "id" : "46fe355c51684ee78bb1bbc1e7941be5"
         }
       }
It’s important to note that Lightrun’s logs are also shown in the Plugin Console, accessible from the bottom gutter of the IDE window:
Give it a try
If you want to take a crack at this yourself, feel free to open Elastic Cloud and Lightrun Cloud accounts to get started with full-cycle observability.
Curious to learn more? Join our meetup in collaboration with Lightrun on September 7th! See event link here.
It’s Really not that Complicated.
You can actually understand what’s going on inside your live applications.