
The Hidden Costs of Logging and What can Developers Do About It?
With the growing adoption of remote and distributed application development including microservices, cloud-native applications, serverless, and more, it is becoming challenging more than ever before for developers to troubleshoot issues within a reasonable time, and that is a bottleneck. That in a sense contradicts the objectives of Agile and DevOps through fast feedback loops, continuous delivery, quick MTTR (mean time to resolution of defects), etc.
Introduction to Logging Costs
Troubleshooting relies heavily on context-based telemetry including logs, metrics, and more, and developers throughout the development lifecycle are adding a lot of them!. The reason these logs are added is to provide a safety net for issues that may come later on in production. The thing about these logs is that a good percentage of them is never used and they pile up.
According to an independent study of Heroku logs, every single log line weighs 0.032 KB. If you multiply it by few thousands (e.g. 5000), when it’s emitted daily across your customers, on a monthly basis it can get up to a 4.8MB size (5,000 * 30 * 0.032), but this is for only one log line. Looking at 100 lines you easily “grow” to a 480MB size, and that would cover only a single code path. When looking at a modern and complex application as mentioned above, you could look at few hundreds of code paths that you would target. As an example for 500 code paths in a given application you can easily scale up to 240GB.
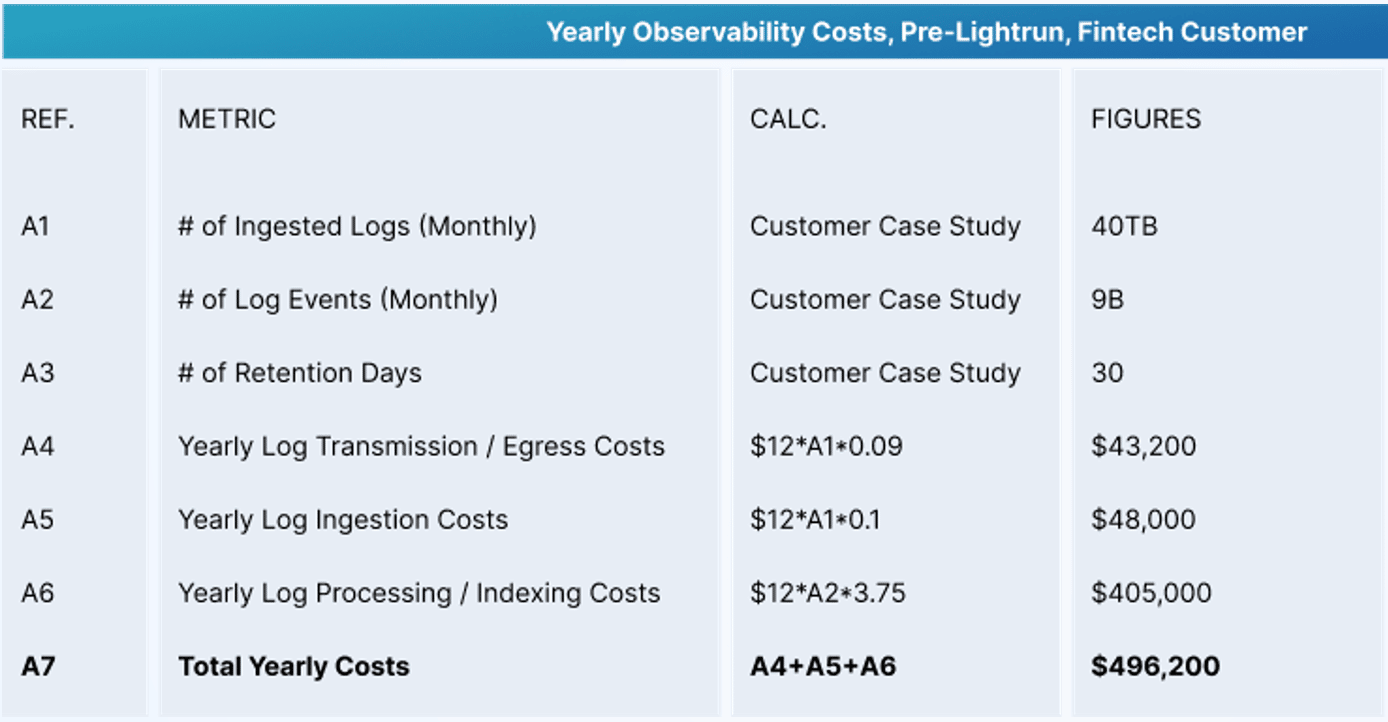
If you look at a high level calculation of logging costs adapted from a real-world observability bill, you can see the aggregated costs of scaled logs broken down according to a few different metrics:
Shift Left FinOps and FinOps Framework
Tackling hidden costs of logging and overall spending on cloud computing starts with cross-team collaboration and transparency into the following aspects:
- What engineering teams are spending on from cloud perspective
- Why are they spending these budgets?
- Where can they optimize.
Collaboration must include business, IT, and developers that specifically to this article topic, are the heavy consumers of logs.
Based on a recent state of FinOps report that was created by the FinOps foundation, 30% of the responders stated that one of the biggest challenges in FinOps today is getting engineers to take active actions around cost optimization throughout their development lifecycle.
Taking action around cloud computing cost optimization should focus on may pillars including log utilization, cutting back on redundant use of 3rd party tools throughout the development process, rightsizing of resources, and more.
The only way to optimize these costs is by shifting FinOps accountability to developers and providing them with tools, reports, and metrics so there is a clear business value and awareness into recurring spending.
One of the methods especially around cutting hidden costs around logging, is the usage and implementation of dynamic instrumentation.
Dynamic Instrumentation & Logging Cost Optimization
As mentioned above, logging everything is a very costly habit. Engineering teams ought to optimize their logging strategy throughout the entire SDLC, and only add logs to the most critical application paths and to areas in which they often need telemetry data from (security-related areas, historical defects observability, etc.).
The rest of the logging volume that we typically create can be referred to as “just in case” logging, should be removed and replaces with the Dynamic Logging process. When adopting such a methodology, developers are in a position to “Log as and When” they need instead of “Logging Everything and Analyzing Later”.
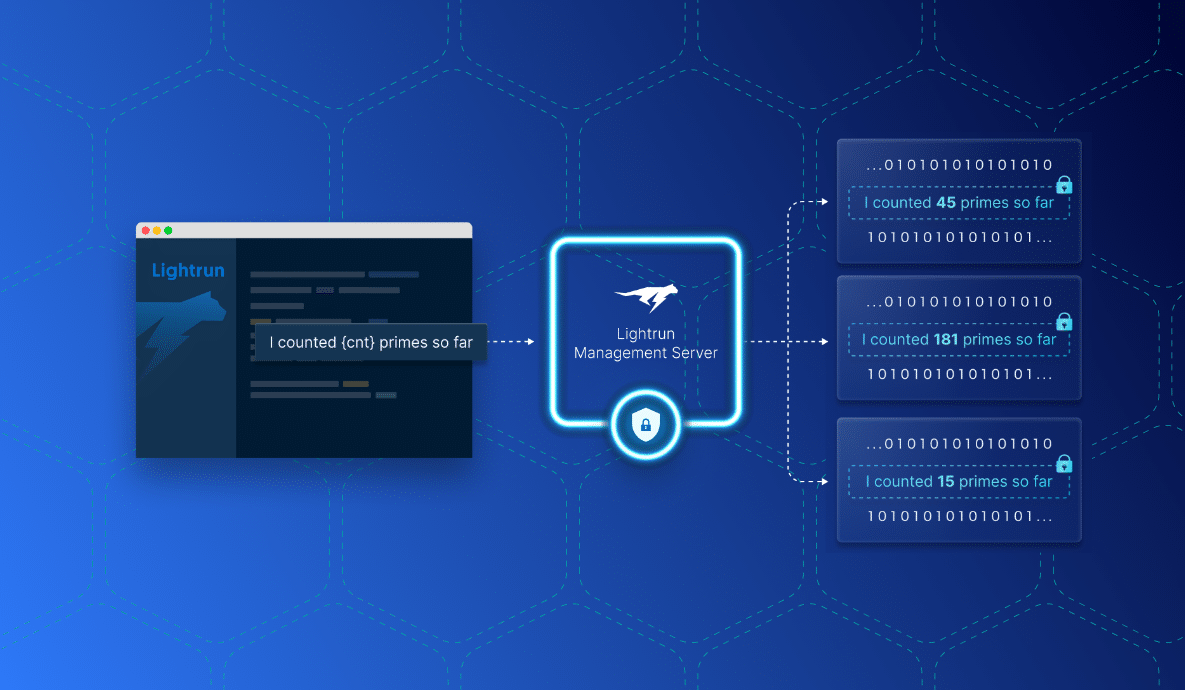
Since with Dynamic Logging new telemetry can be added seamlessly in real time, developers can focus on writing only critical logs upfront, during development. Then, as the need arises, they can add logs dynamically – without relying on a release cycle to do so. Such a practice significantly reduces log volumes, saves developer time, and prevents deployment delays.
4 Core Principles of Dynamic Logging Include:
- Log what you need when you need it instead of logging everything and then analyzing it later
- Remove all instances of logs that are used for troubleshooting, and add them at runtime
- Connect developers to the live execution without ever leaving the IDE
- Add & consume logs in a way that is built for developers, not just for operators
As outlined above, with dynamic logging, developers are connected more than ever before to their live running applications across any environment in which they run (PROD, STAGING, QA, etc.), and when the need arises to troubleshoot an issue, they have the right tools from their native environment (IDEs) to effectively add telemetry and resolve these issues. This closes the loop between dev and production and ensures MTTRs of critical issues in production are minimal and SLAs between business and customers is kept.
Bottom Line
As applications are maturing, and developers are embracing DevOps methodologies, barriers between them and their applications in production must be broken for efficiency and agility. Without dynamic instrumentation, developers cannot gain in-time visibility into their distributed applications from their local IDEs, and that slows down the entire cycle of troubleshooting.
Redeployments for the sake of only adding more logs is by far an expensive and inefficient method, hence, shifting toward dynamic logging helps Dev, Ops, IT, and the entire business unit to serve their objectives in a cost-effective and productive manner.
As highlighted above and in a recent report on Lightrun’s economic impact, the cost savings of moving to dynamic logging spans through both cost optimization, reduction in MTTR, and developer productivity. Those 3 benefits together have a saving costs number that is very significant.


It’s Really not that Complicated.
You can actually understand what’s going on inside your live applications.