
Lightrun’s Product Updates – Q2 2023
During the second quarter of this year, Lightrun persisted producing a wealth of developer productivity solutions and enhancements, aiming for greater troubleshooting of distributed workload applications, reduction of MTTR for complex issues, and cost optimization within cloud-computing.
Read more below the main new features as well as the key product enhancements that were released in Q2 of 2023!
📢 NEW! Lightrun Support for Troubleshooting .NET Applications !
Lightrun extended its runtime support with the addition of .NET applications debugging. With this new capability, developers can troubleshoot live applications directly from the VSCode, VSCode.dev, and JetBrains Rider IDE plugins and resolve issues quickly. The support for .NET runtime also enhances the depth of troubleshooting through custom expressions, top-notch security, support for the latest framework (.NET 7), stability, and multiple deployment options support (On-Premise, SaaS).
The Lightrun dedicated package for .NET is available through the NuGet gallery. To learn more about this new runtime support and get started with it, please read this blog.
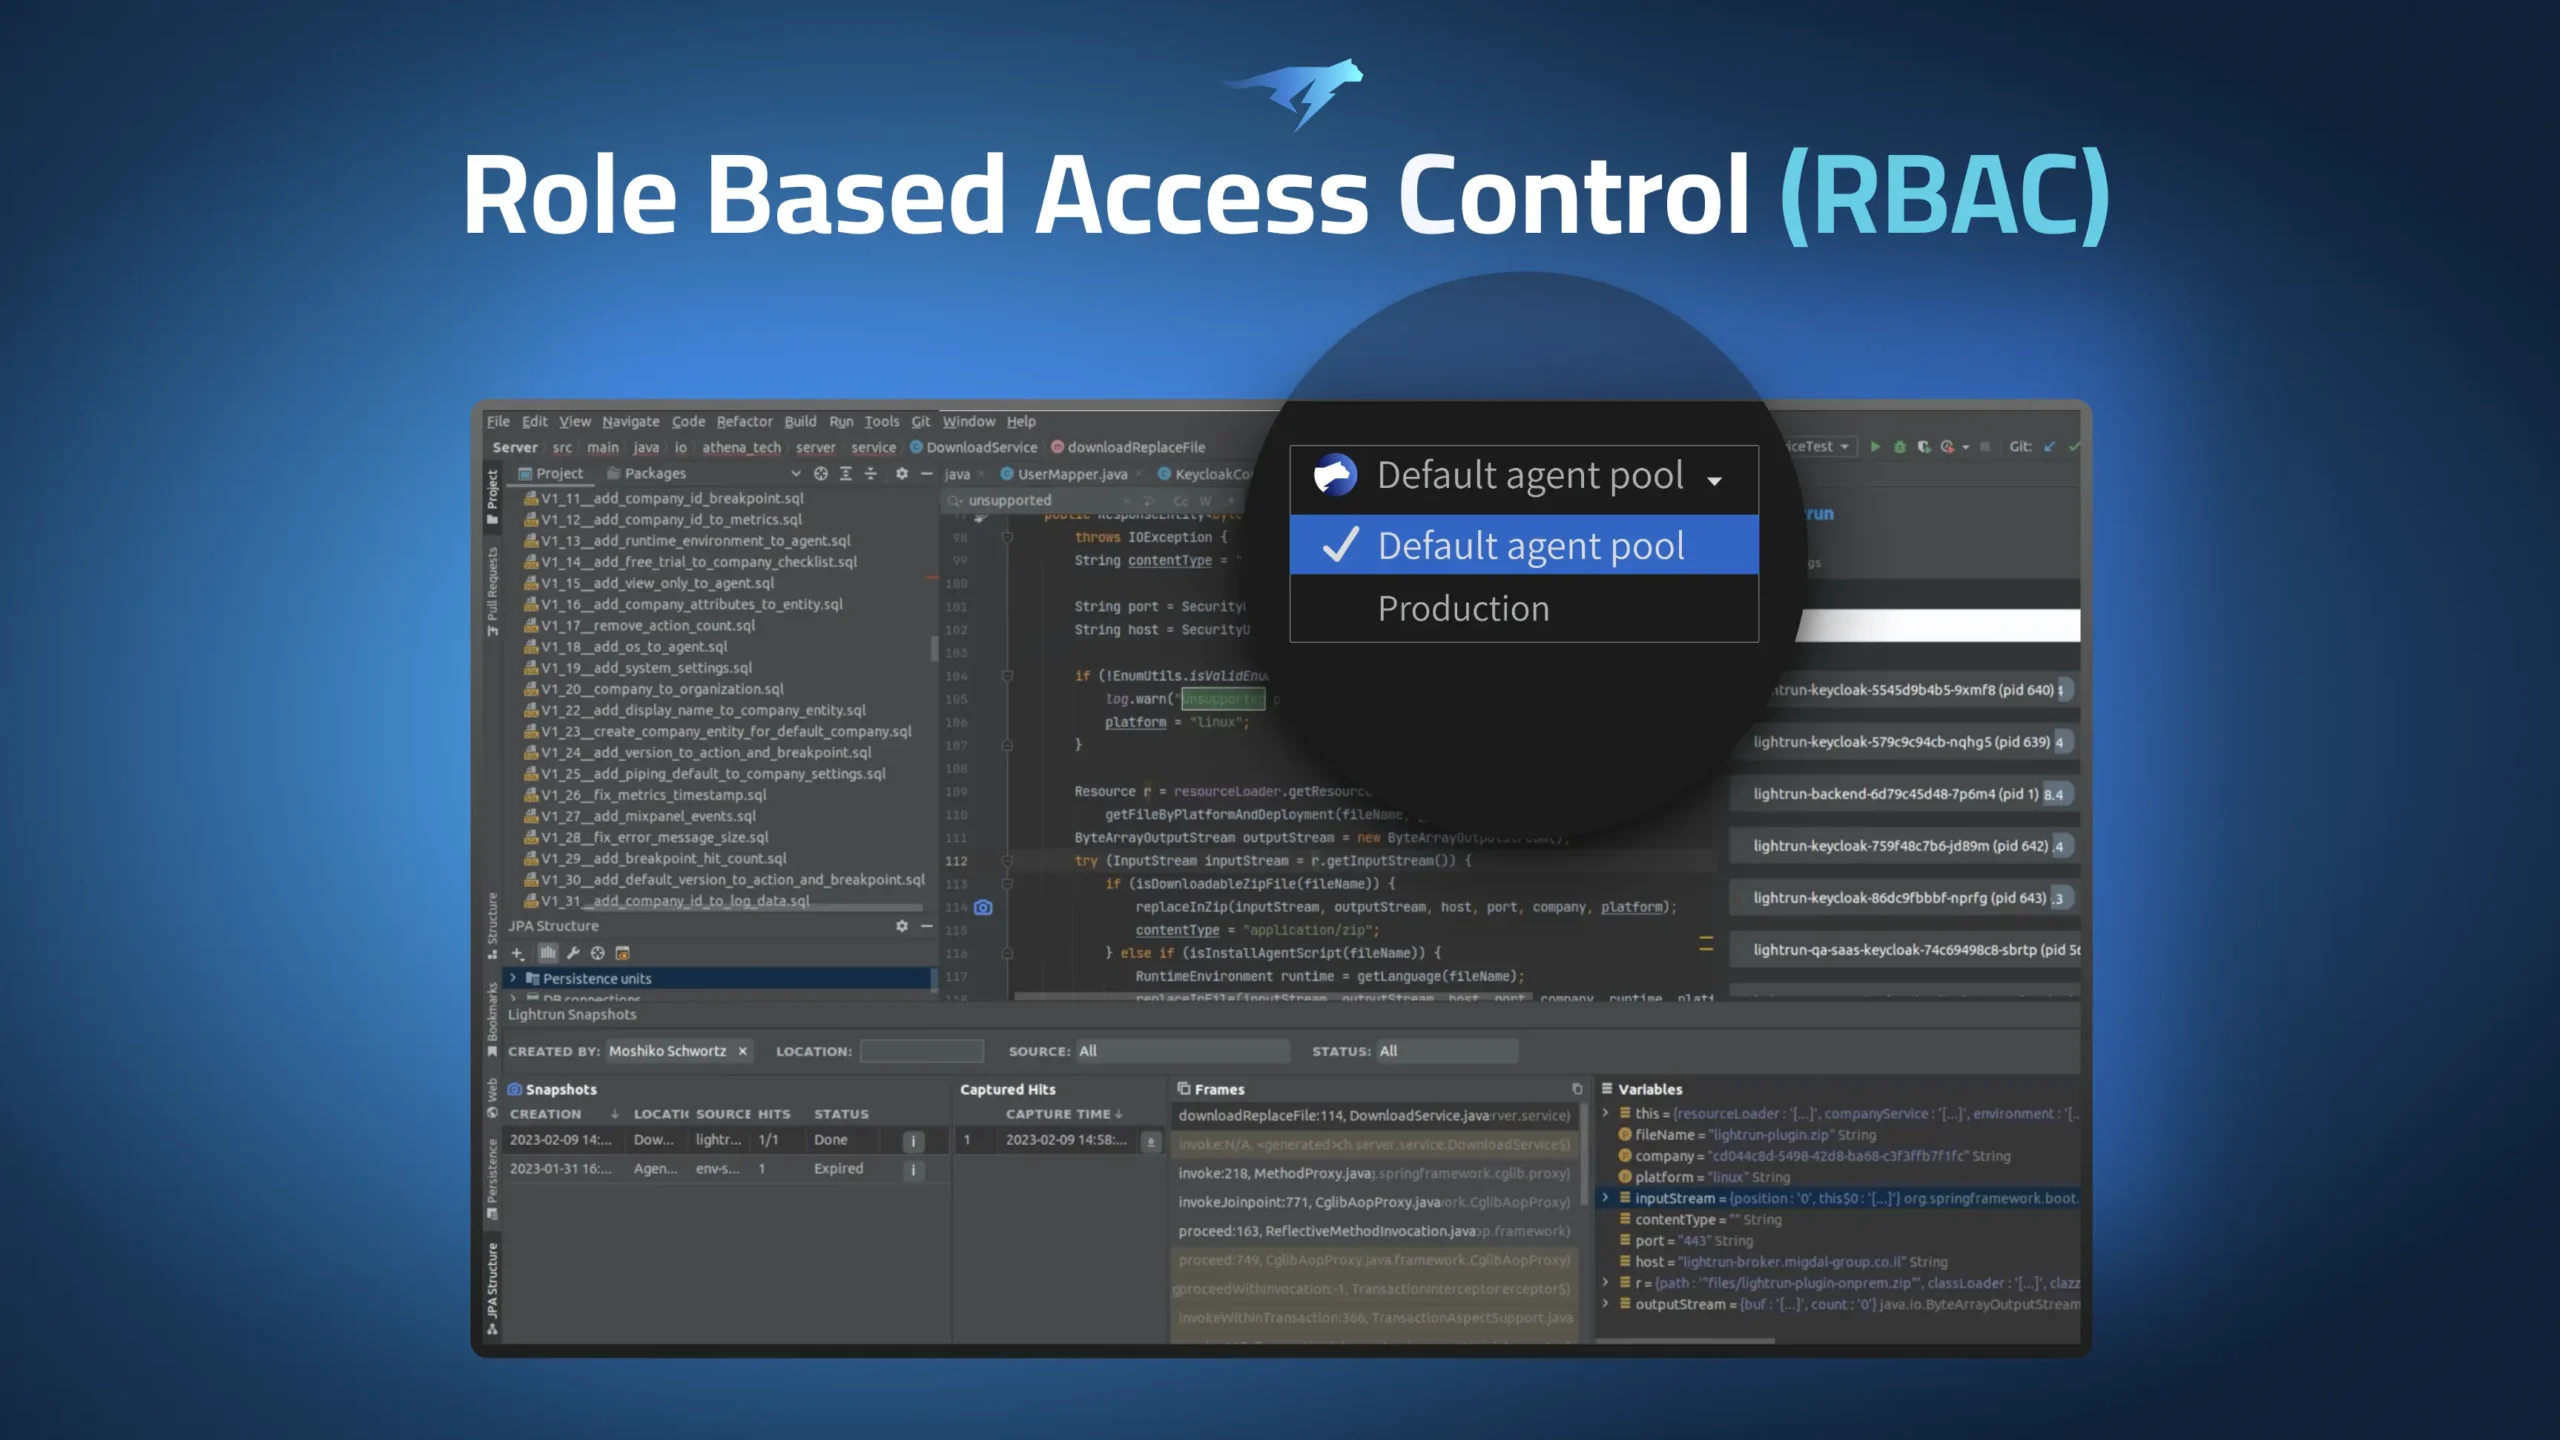
📢 New! RBAC Support for Enhanced Enterprise-Grade Security and Governance
Lightrun enhances its enterprise-grade platform with the addition of RBAC (role based access control) support to ensure that only authorized users have access to sensitive information and resources as they troubleshoot their live applications. By using Lightrun’s RBAC solution, organizations can create a centralized system for managing user permissions and access rights, making it easier to enforce security policies and prevent security breaches.
This solution offers 3 main components: User groups, User Roles, and Agent Pools. To learn more about the benefits and settings of RBAC, read our documentation.
This feature helps improve organization’s data security and streamlines its workflows. For more information and help with setting this up, please reach out to our support team.
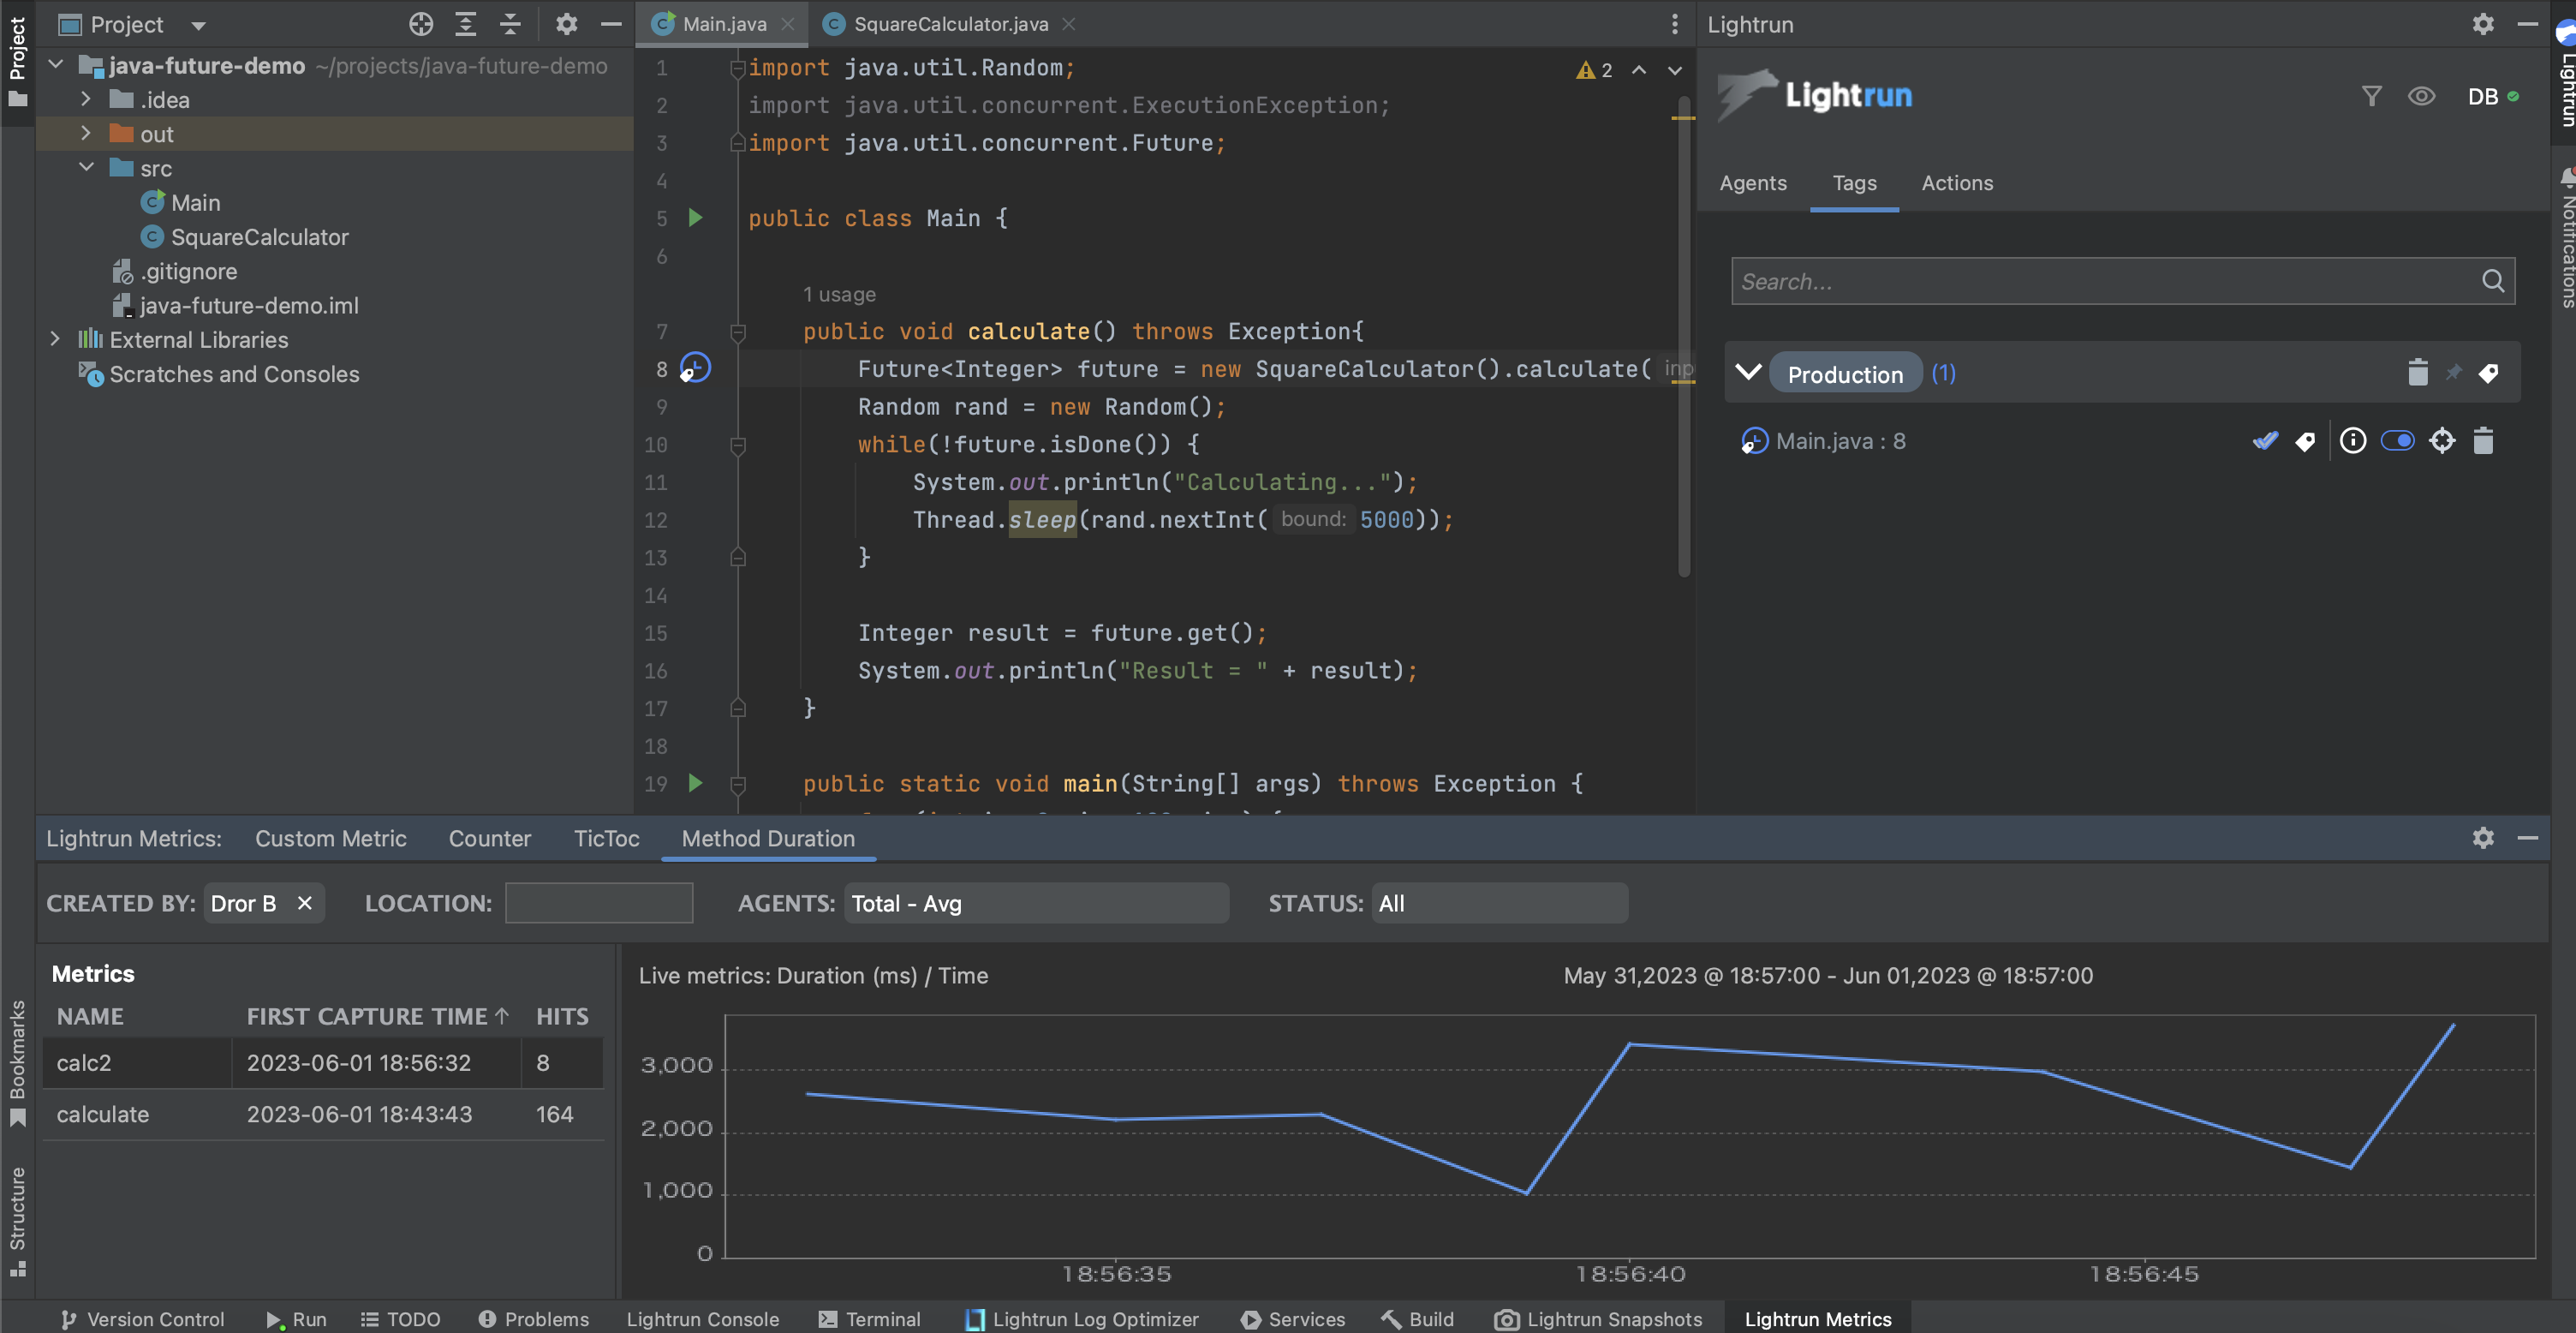
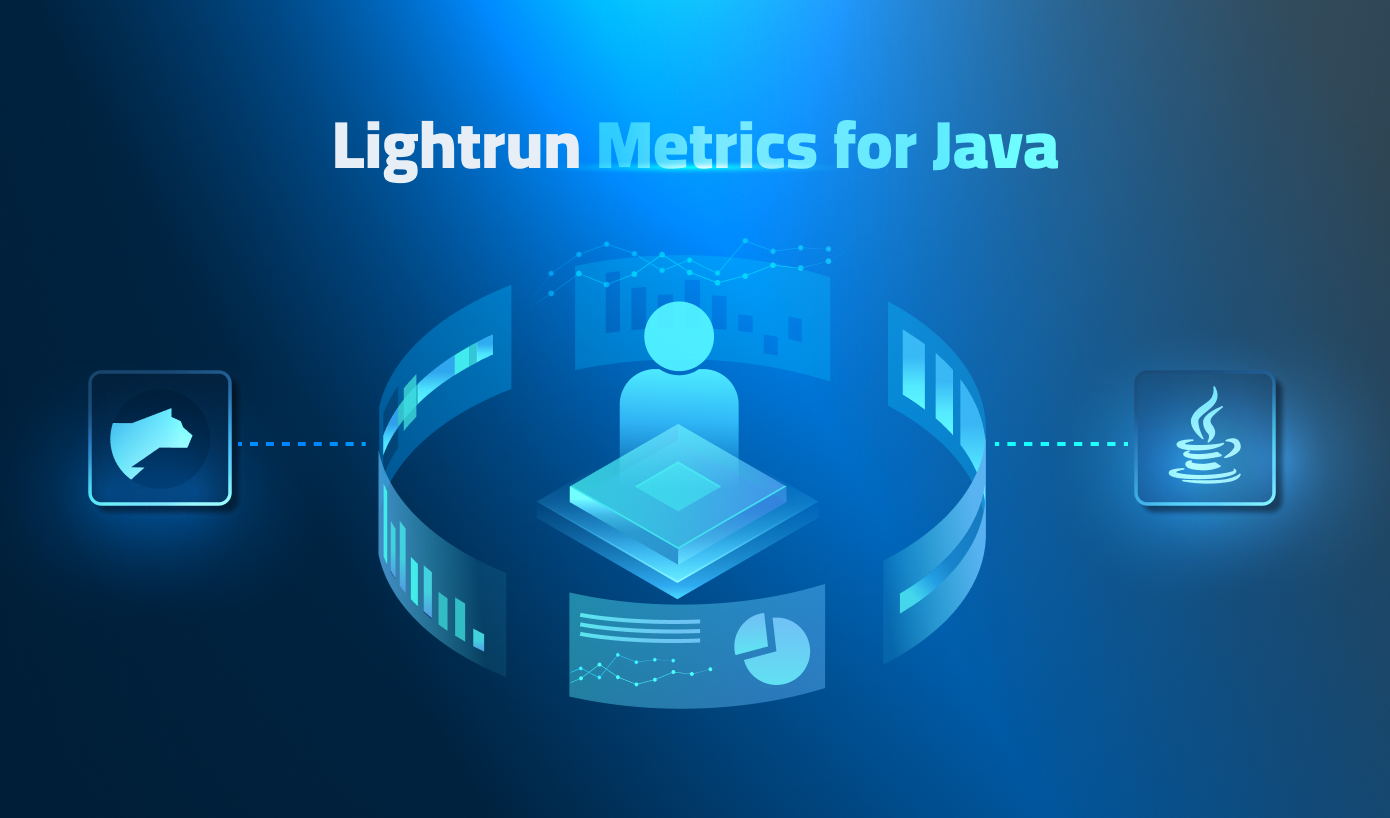
📢 NEW! Lightrun Metrics for Java Runtime Support 🎉
Lightrun has also launched an upgraded version of Metrics integrated with the IntelliJ IDE plugin for Java runtime troubleshooting. The enhanced Lightrun Metrics solution is now available as a separate tab in the plugin, providing developers with a dedicated tool to address application performance-related problems. Previously, all outputs from Metrics were directed to the Lightrun console, but with the latest implementation, these outputs are sent to the newly introduced tab within the plugin.
With the enhanced implementation, the Lightrun metrics helps developers tackle the following common challenges:
- Complexity around contributing factors to performance issues (infrastructure related issues, 3rd Party services performance, concurrency, etc.)
- Reproducing performance issues locally is a huge challenge, with Lightrun Metrics, developers can avoid the hassle of setting up a production environment with the right data as they debug performance issues.
- Performance issues often are specific to users or segments, hence, pinpointing them to a specific client or segment using profilers and APM tools is hard. In addition, such tools (APMs) do not provide code related information. With Lightrun Metrics, developers would find it intuitive to debug such issues directly from the IDE dedicated plugin tab.
The solution currently supports the collection of 4 different KPIs:
- Tic-Toc (Block Duration) – Measures the elapsed time for executing a specified block of code, within the same function
- Method Duration – Measures the elapsed time for executing a given method
- Custom Metric – Enables developers to design their own custom metric, using custom expressions that evaluate to a numeric result of type long. Custom metrics can be created using the configuration form in the Lightrun IDE plugin or from the CLI
- Counters (coming soon!) – Counts the number of times the code line is reached
Each of the above supported metrics is being collected and calculated on a 24 hours timeline as well as can be analyzed within a specific time range to allow developers to zoom into specific issues. In addition, developers can gain metrics visibility per single runtime agent or across multiple ones (See Lightrun Metrics for Java in action in this demo video).
To get started with Lightrun Metrics and learn more, please refer to our documentation.
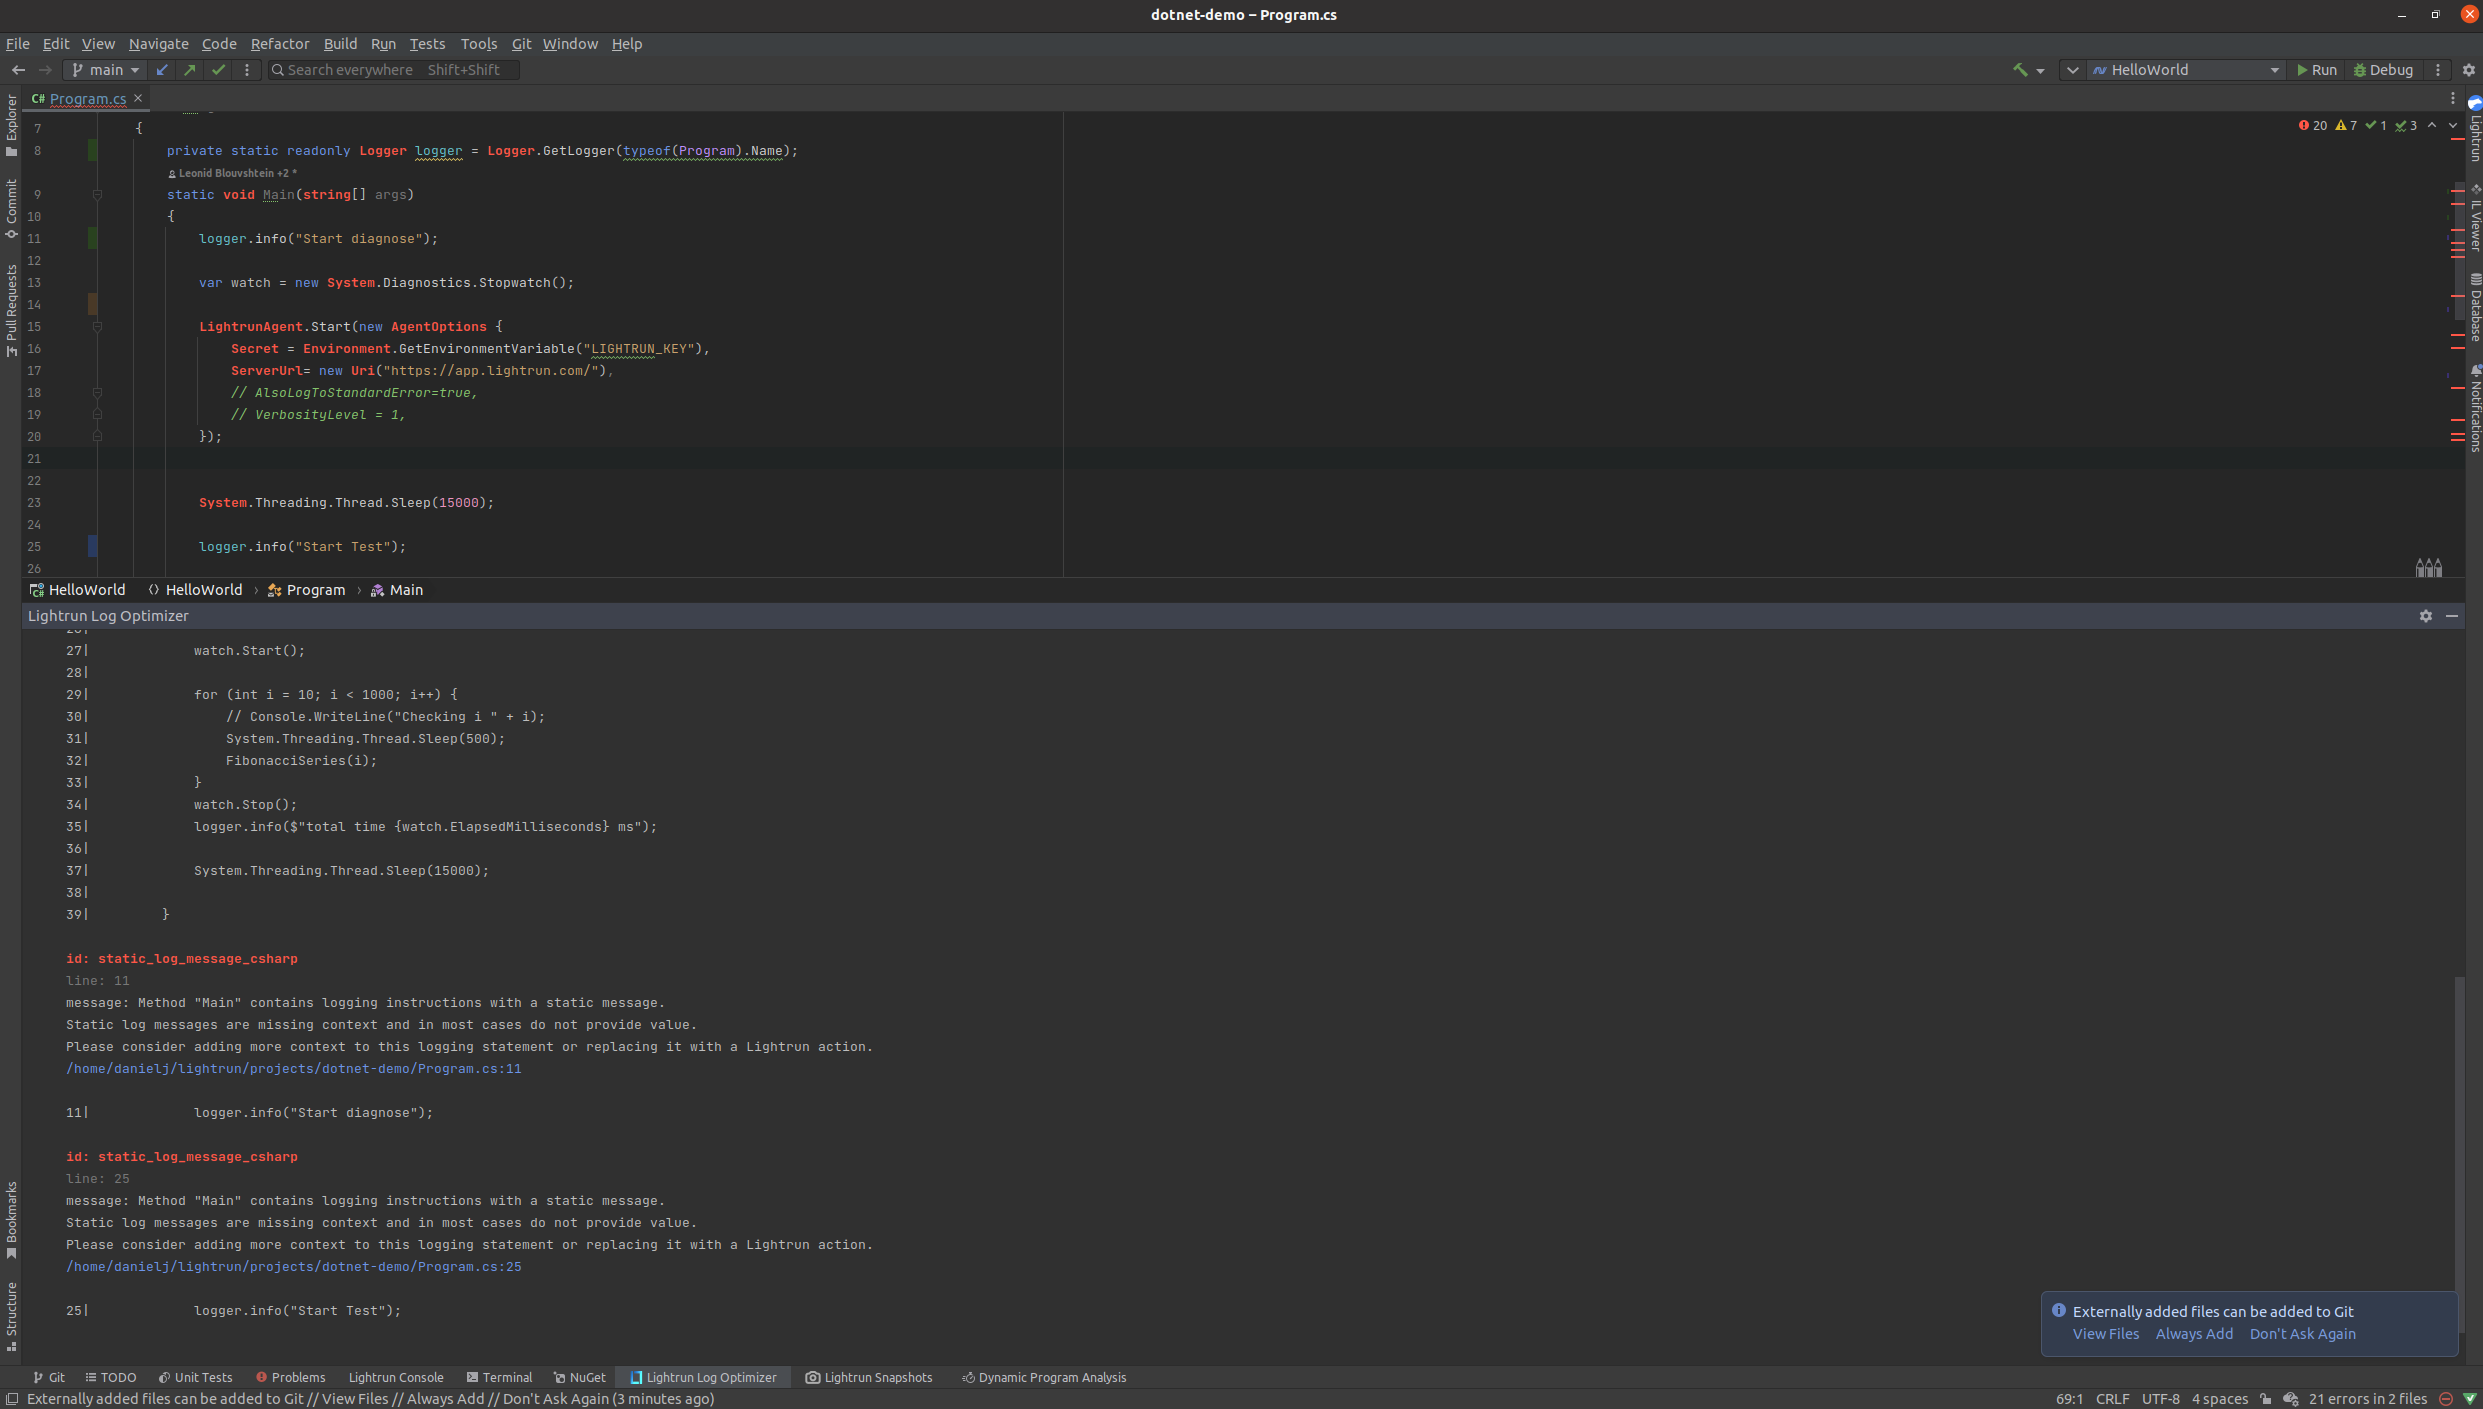
📢 NEW! LogOptimizer™ Support for .NET Runtime
In addition to the previously supported runtime development languages including Java, JavaScript, and Python, Lightrun introduced its support for .NET to allow developers to optimize their overall cost of logging within their .NET applications. With the LogOptimizer™ solution, developers can receive a report showing the main log lines that are candidates for replacement with Dynamic Logs.
To learn more about the LogOptimizer, please read more here.
Feel free to visit Lightrun’s website to learn more or if you’re a newcomer, try it for free!
It’s Really not that Complicated.
You can actually understand what’s going on inside your live applications.