Maximizing CI/CD Pipeline Efficiency: How to Optimize your Production Pipeline Debugging?
Introduction
At one particular time, a developer would spend a few months building a new feature. Then they’d go through the tedious soul-crushing effort of “integration.” That is, merging their changes into an upstream code repository, which had inevitably changed since they started their work. This task of Integration would often introduce bugs and, in some cases, might even be impossible or irrelevant, leading to months of lost work.
Hence Continuous Integration and continuous deployment (CI/CD) was born, enabling teams to build and deploy software at a much faster pace since the inception of the paradigm shift allowing for extremely rapid release cycles.
Continuous Integration aims to keep team members in sync through automated testing, validation, and immediate feedback. Done correctly, it will instill confidence in knowing that the code shipped adheres to the standards required to be production ready.
However, although many positive factors are derived from CI/CD pipeline, this has since evolved into a complex puzzle of moving parts and steps for organizations where problems occur frequently.
Usually, errors that occur in the pipeline happen after the fact. You have N number of pieces to the puzzle that could fail even if you can resolve some of these issues by piping your logs to a centralized logging service and tracing from there. You are not able to replay the issue.
You may argue for the case of static debugging instances. In this process, one usually traces an error via a stack trace exception or error that occurs. Then you make calculated guesses about where the issue may have happened.
This is then usually followed by some code changes and local testing to simulate the issue and then followed by Deploying the code and going through a vicious cycle of cat and mouse to identify issues.
Issues with CI/CD Pipelines and Debugging
Let’s break down some fundamental issues plaguing most CI/CD pipelines. CI/CD builds, and production deployments rely on testing and performance criteria. Functional testing and validation testing could be automated but challenging due to the scope of different scenarios in place.
Identifying the root cause of the issue
It can be challenging to determine the exact cause of a failure within a CI/CD pipeline while debugging complex pipelines consisting of many stages and interdependent processes can be difficult to understand and comprehend what went wrong and how to fix it.
At its core, a lack of observability and limited access to logs or lack of relevant information can make it challenging to diagnose issues, and at times, the inverse excessive logging and saturation cause tunnel vision.
Another contributing factor If code coverage is low as well edge case scenarios that could potentially be breaking your pipeline will be hard to discover for those that work in a Monorepo environment, issues are exacerbated where shared dependencies and configurations originate from multiple teams or developers that push code without verification cause a dependence elsewhere to break the build deploy pipeline.
How to Optimize your CI/CD Pipeline?
There will be times when you believe you’ve done everything correctly, but something still needs to be fixed.
- Your pipeline should have a structured review process.
- You need to ensure the pipeline supports automated tests.
- Parallelization should be part of your design, with caching of artifacts where applicable.
- The pipeline should be built, so it Fails fast with — a feedback loop.
- Monitoring should be by design.
- Keep builds and tests lean.
All these tips won’t help much if you don’t have a way to observe your pipeline.
Why Should Your CI/CD Pipeline be Observable?
A consistent, reliable pipeline helps teams to integrate and deploy changes more frequently. If any part of this pipeline fails, the ability to release new features and bug fixes grinds to a halt.
An observed pipeline helps you stay on top of any problems or risks to your CI/CD pipeline.
An observed pipeline provides developers with the visibility of their tests, and will they will finally know whether the build process they triggered was successful or not. If it fails, the “Where failed” question is answered immediately.
Not knowing what’s going on in the overall CI/CD process and need to know overall visibility to see how it’s going and overall performance is no longer a topic of discussion.
Tracing issues via different interconnected services and understanding the processing they undergo end to end can be difficult, especially when reproducing the same problem in the same environment is complex or restrictive.
Usually, DevOps and Developers generally try to reproduce issues via their Local environment to understand the root cause, which brings additional complexities of local replication.
Architecture CI/CD pipeline
To put things into context — let’s work through an example of a typical production CI/CD pipeline.
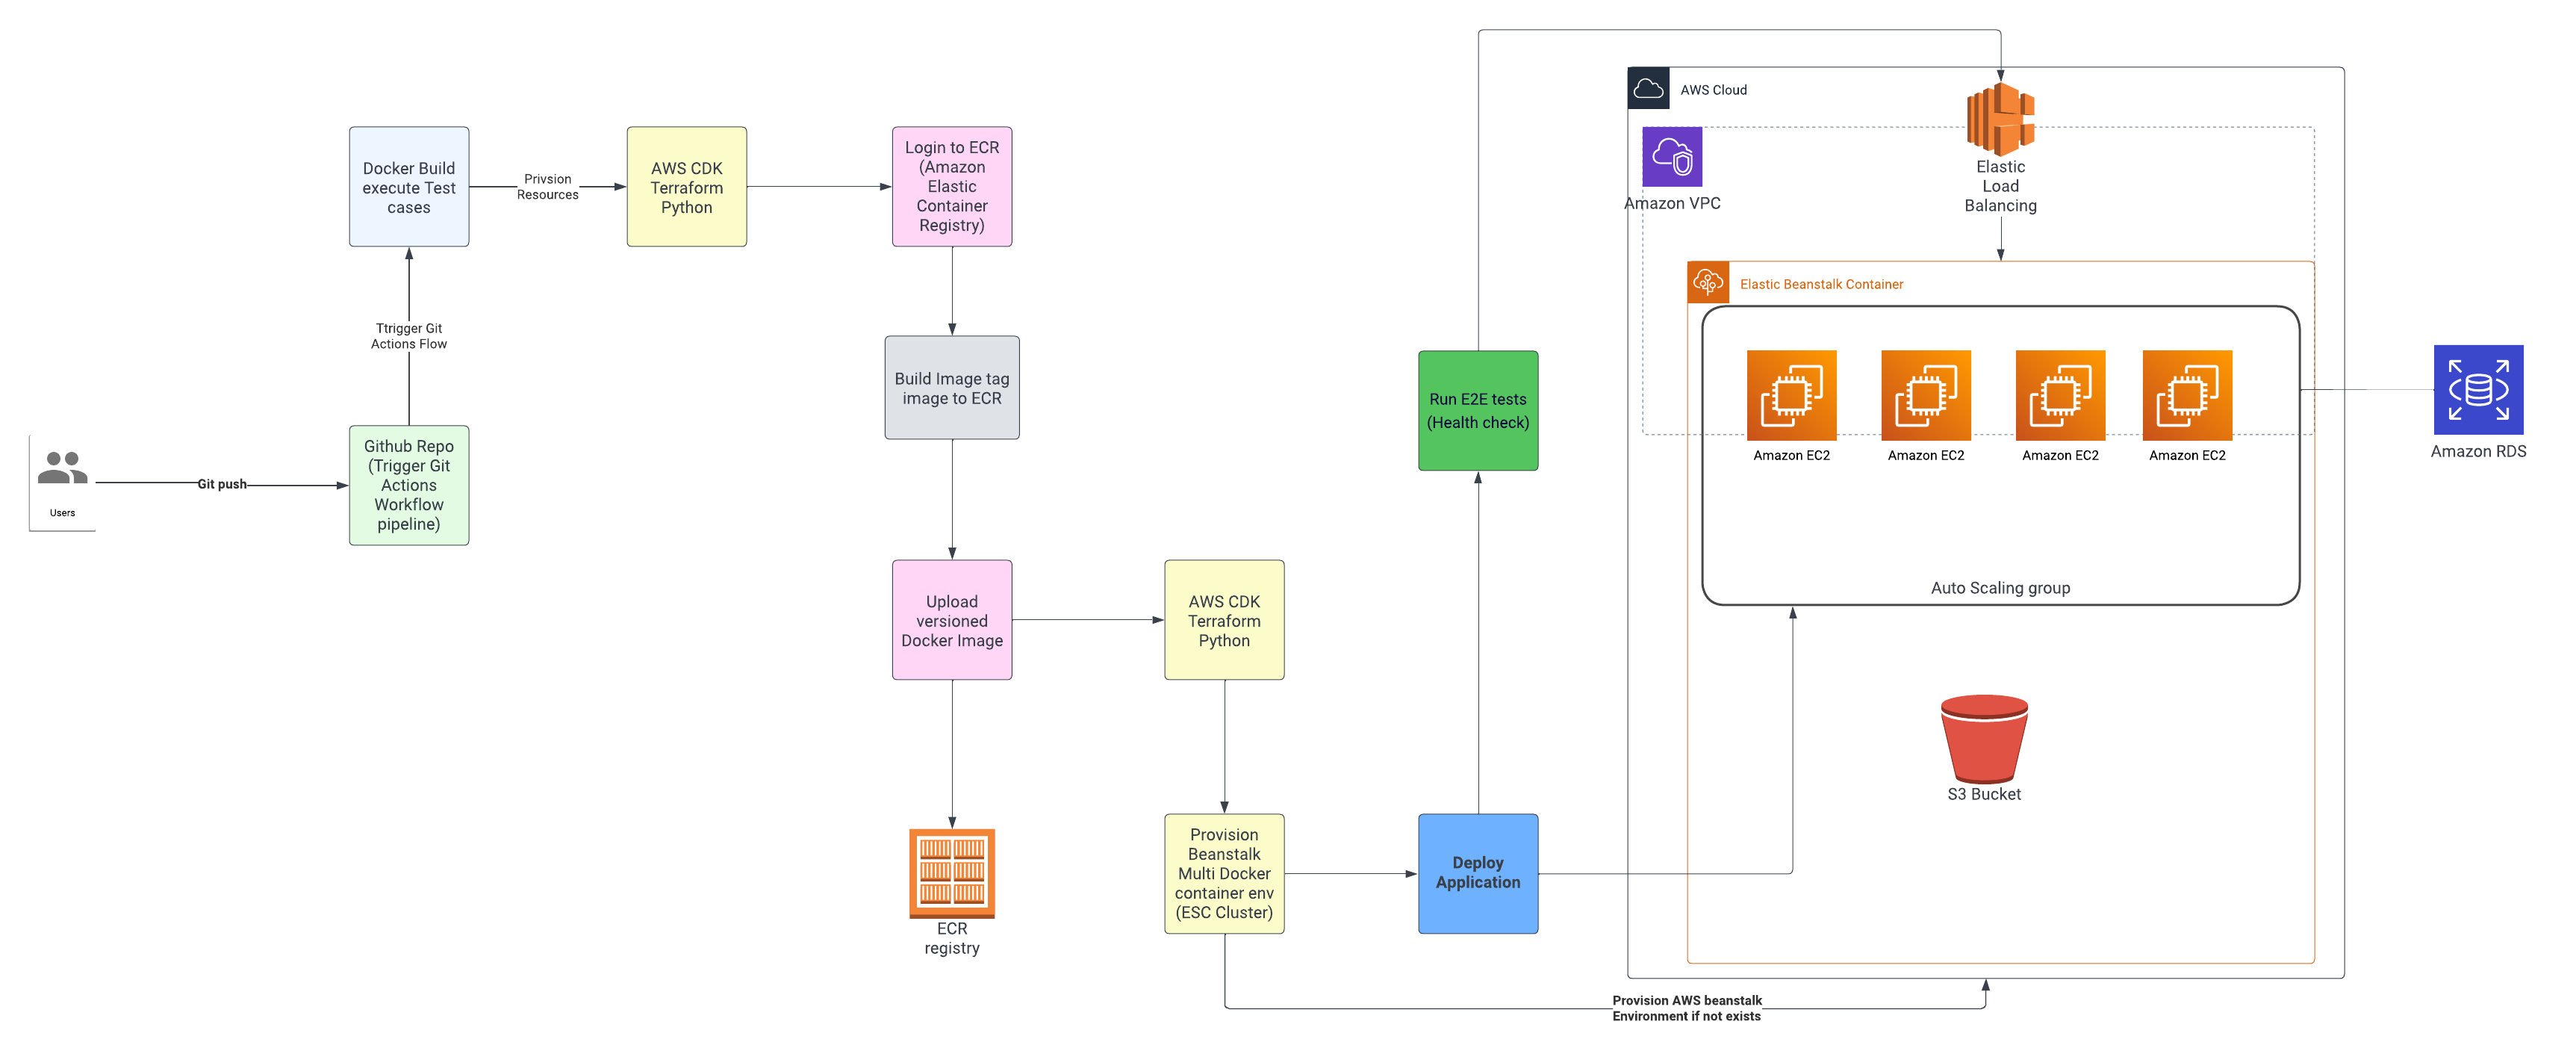
CI/CD pipeline with GitActions and AWS CDK AWS Beanstalk
The CODE
The CI/CD pipeline starts with the source code via Github with git actions to trigger the pipeline. GitHub provides ways to version code but does not track the impact of changes of commits developers make into the repository. For example,
- What if a certain change introduces a bug?
- What if a branch merge resulted in a successful build but failed deployment?
- What if the deployment was successful, then a user received an exception, and it’s already live in production?
BUILD Process
The build process with test cases for code coverage is a critical point of failure for most deployments. If a build fails, the team needs to be notified immediately in order to identify and resolve the problem quickly. You may say they are options like setting alerts to your slack channel or email notifications that can be configured.
Those additional triggers can alert you though they need to provide the ability to trace and debug the issues in a timely manner as one still needs to dig into the code. Failure may be due to some more elusive problems such as missing dependencies.
Unit & Integration TESTS
It’s not enough to know that your build was successful. It also has to pass tests to ensure changes don’t introduce bugs or regressions. Frameworks such as JUnit, NUnit, and pytest generate test result reports though these reports output failed cases but not the how part.
Deploy Application
Most pipelines have pivoted to infrastructure as code where code dictates how Infrastructure provisioning is done. In our example AWS CDK lets you manage the infrastructure as code using Python. While empowering Developers we have the additional complexity of code added which becomes hard to debug.
Post-Deploy Health Checks
Most deployments have an extra step to verify the health such as illustrated in our pipeline. Such checks may include Redis health, and Database health. Since these checks are driven by code we yet have another opportunity for failure that may hinder our success metric.
Visually Illustrating Points of Failure in the CI/CD Pipeline
Below illustrates places that can potentially go wrong i.e Points of failure. This exponentially gets more complex depending on how your CI/CD pipeline has been developed.

Points of failure in our example CI/CD pipeline
Dynamic Debugging and Logging to Remedy your Pipeline Ailments
Let’s take a look at how we can quickly figure out what is going on in our complex pipeline. A new approach of shifting left observability which is the practice of incorporating observability into the early stages of the software development lifecycle via applying a Lightrun CI/CD pipeline Observable Pattern.
Lightrun takes a developer-native observability first approach with the platform; we can begin the process of strategically adding in agent libraries in each component in our CI/CD pipeline, as illustrated below.
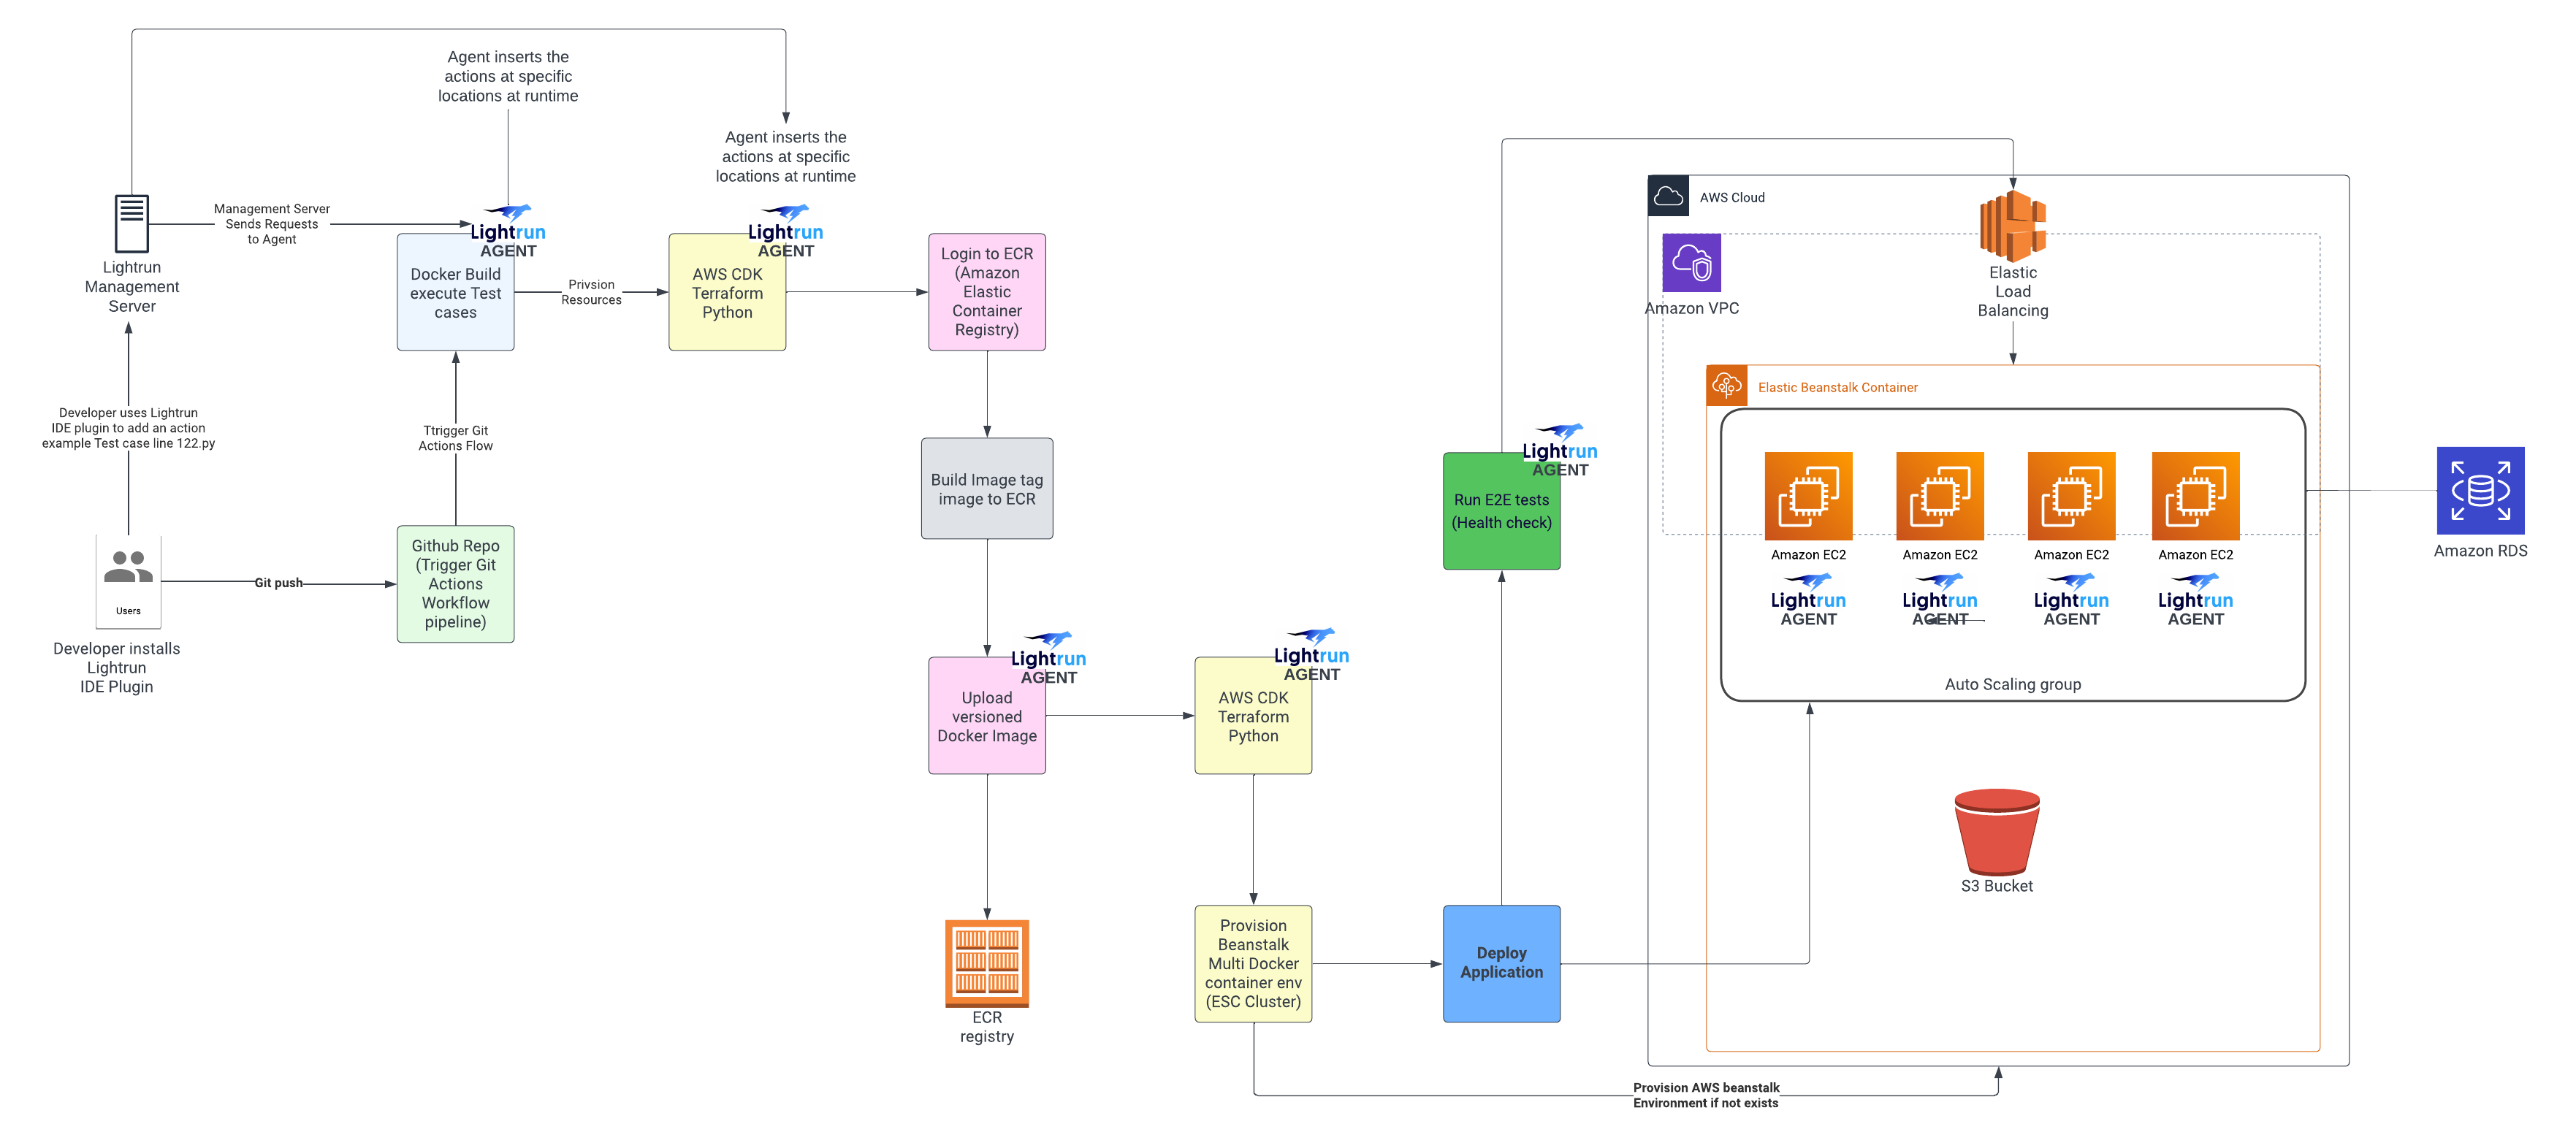
Lightrun CI/CD pipeline pattern
Each agent will be able to observe and introspect your code as part of the runtime, allowing you to directly hook into your pipeline line directly from your IDE via a Lightrun plugin or CLI.
This will allow you then to add virtual breakpoints with logging expressions of your choosing to your code in real-time directly from your IDE, i.e., in essence, remote debugging and remote logging such as you would do on your local environment by directly linking into production.
Since virtual breakpoints are non-intrusive and capture the application’s context, such as variables, stack trace, etc., when they’re hit, This means no interruptions to execute code in the pipeline and no further redeployments would be required to optimize your pipeline.
Lightrun Agents can be baked into Docker images as part of the build cycles. This pattern can be further extended by making a base Docker image that has your Lightrun unified configurations inherited by all microservices as part of the build, forming a chain of agents for tracking.
Log placement in parts of the test and deploy build pipeline paired with real-time alerting when log points are reached can minimize challenges in troubleshooting without redeployments.
For parts of code that do not have enough code coverage — all we will need to do is add Lightrun counter metric to bridge the gap to form a coverage tree of dependencies to assist in tracing and scoping what’s been executed and its frequency.
Additional Metrics via the Tic & Toc metric that measures the elapsed time between two selected lines of code within a function or method for measuring performance.
Customized metrics can further be added using custom parameters with simple or complex expressions that return a long int results
Log output will immediately be available for analysis via either your IDE or Lightrun Management Portal. By eliminating arduous and time-consuming CI/CD cycles, developers can quickly drill down into their application’s state anywhere in the code to determine the root cause of errors.
How to Inject Agents into your CI/CD pipeline?
Below we will illustrate using python. You’re free to replicate the same with other supported languages.
- Install the Lightrun plugin.
- Authenticated IDE pycharm with your Lightrun account
- Install the python agent by running python -m pip install lightrun.
pip install lightrun- Add the following code to the beginning of your entrypoint function
import os

LIGHTRUN_KEY = os.environ.get('YOUR_LIGHTRUN_KEY')

LIGHTRUN_SERVER = os.environ.get('YOUR_LIGHTRUN_SERVER_URL')

def import_lightrun():

   try:

       import lightrun

       lightrun.enable(com_lightrun_server=LIGHTRUN_SERVER, company_key=LIGHTRUN_KEY, lightrun_wait_for_init=True, lightrun_init_wait_time_ms=10000,  metadata_registration_tags='[{"name": "<app-name>"}]')

   except ImportError as e:

       print("Error importing Lightrun: ", e)
as part of the enable function call, you can specify lightrun_wait_for_init=True and lightrun_init_wait_time_ms=10000 as part of the Python agent configuration.
These two configuration parameters will ensure that the Lightrun agent starts up fast enough to work within short-running service functions and apply a wait time of about 10000 milliseconds before fetching Lightrun actions from the management portal. take note these are optional parameters that can be ignored if it doesn’t make sense to apply them for long-lived code execution cycles e.g running a Django project or fast API microservice applications if your using another language like java the same principles apply.
Once your agent is configured, you can call import_lightrun() function in __init__.py part of your pipeline code can be made to ensure agents are invoked when the pipeline starts.
Deploy your code, and open your IDE with access to all your code, including your deployment code.
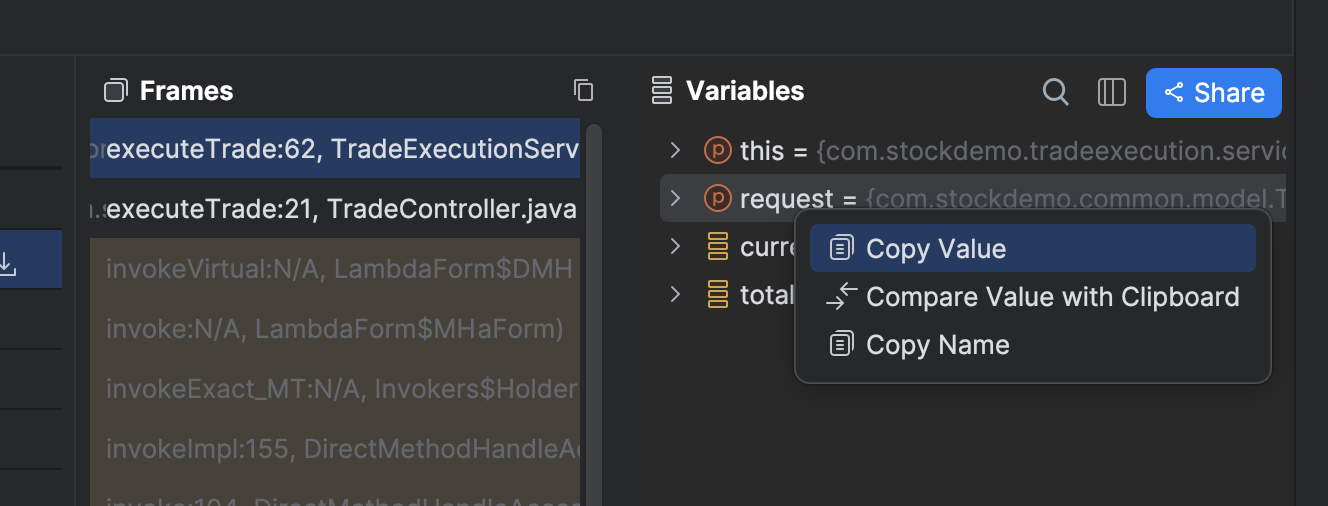
Select the lines of code you wish to trace and open up the Lightrun terminal and console output window shipped with the agent plugin.
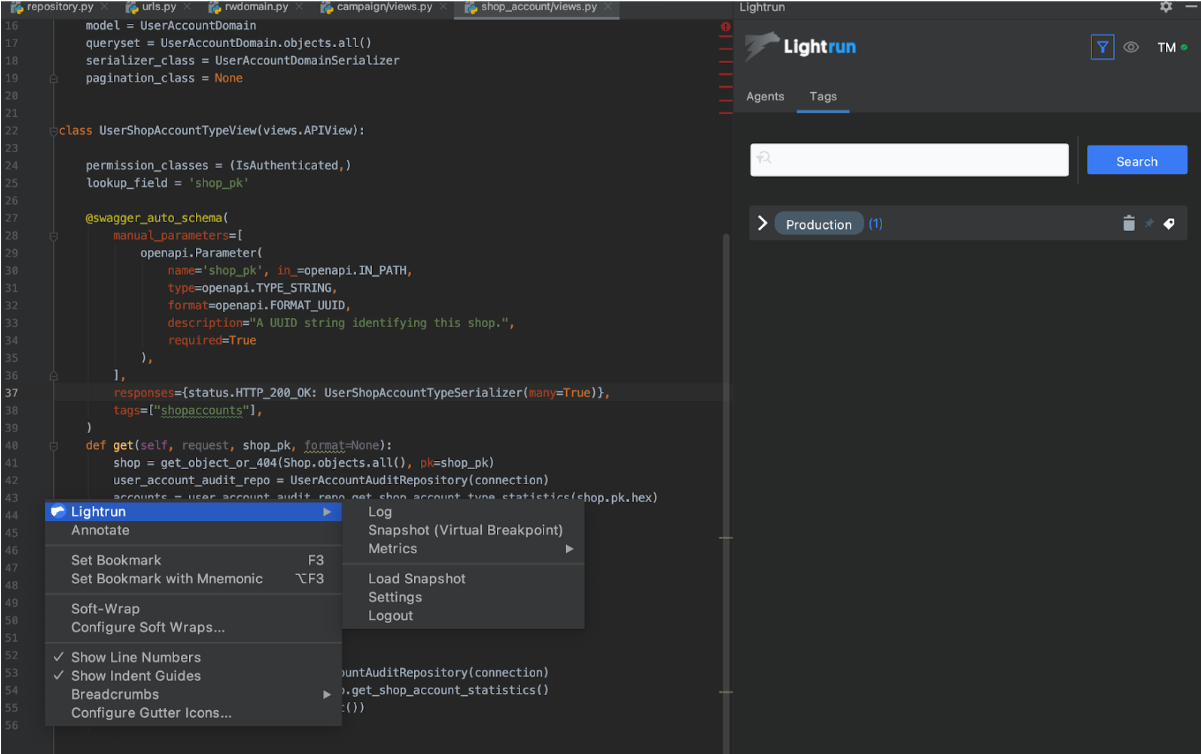
Adding logging to live executing code with Lightrun directly from your IDE
Achieving Unified output to your favorite centralized logging service
If we wish to pipe out logs instead of using the IDE, you can tap into third-party integrations to consolidate the CI/CD pipeline, as illustrated below.

If you notice an unusual event, you can drill down to the relevant log messages to determine the root cause of the problem and begin planning for a permanent fix in the next triggered deploy cycle.
Validation of CI/CD Pipeline Code State
One of the benefits of an observed pipeline is that we can fix the pipeline versioning issues. Without correct tagging, how do you know your builds have the expected commits it gets hard to tell the difference without QA effort.
By adding dynamic log entries at strategic points in the code, we can validate new features and committed code in the pipeline that was introduced into the platform by examining dynamic log output before it reaches production.
This becomes very practical if you work in an environment with a lot of guard rails and security lockdowns on production servers. You don’t worry about contending with incomplete local replications.
Final thoughts
A shift left approach observability in CI/CD pipeline optimization approach can increase your MTTR average time it takes to recover from production pipeline failures which can have a high impact on deploying critical bugs to production.
You can start using Lightrun today, or request a demo to learn more.

It’s Really not that Complicated.
You can actually understand what’s going on inside your live applications.