Reduce 60% of your Logging Volume, and Save 40% of your Logging Costs with Lightrun Log Optimizer
Mar 01, 2023 / Updated: Apr 14, 2026

As organizations are adopting more of the FinOps foundation practices and trying to optimize their cloud-computing costs, engineering plays an imperative role in that maturity. Traditional troubleshooting of applications nowadays relies heavily on static logs and legacy telemetry that developers added either when first writing their applications, or whenever they run a troubleshooting session where they lack telemetry and need to add more logs in an ad-hoc fashion. Other observability solutions only mirror the logs that are in the code that’s running. These tools are not scanning or reflecting the effectiveness of existing new and legacy log statements. To modify or add new and more effective logs to an application, existing observability tools rely on developers to add new ad-hoc logs through an iterative, time consuming, and costly redeployment process. Furthermore, a great amount of these logs will most likely be never consumed or used by the developers, hence, they are piling up and creating more noise in the code than value, and they are costly.
To get engineers to act upon cloud cost optimization, they need shared knowledge and visibility into what contributes to the rising costs, and they need this knowledge accessible from their native environment (their IDEs).
Without actionable data and visibility, engineers cannot be aware of cost related attributes, therefore, cannot address such objectives.
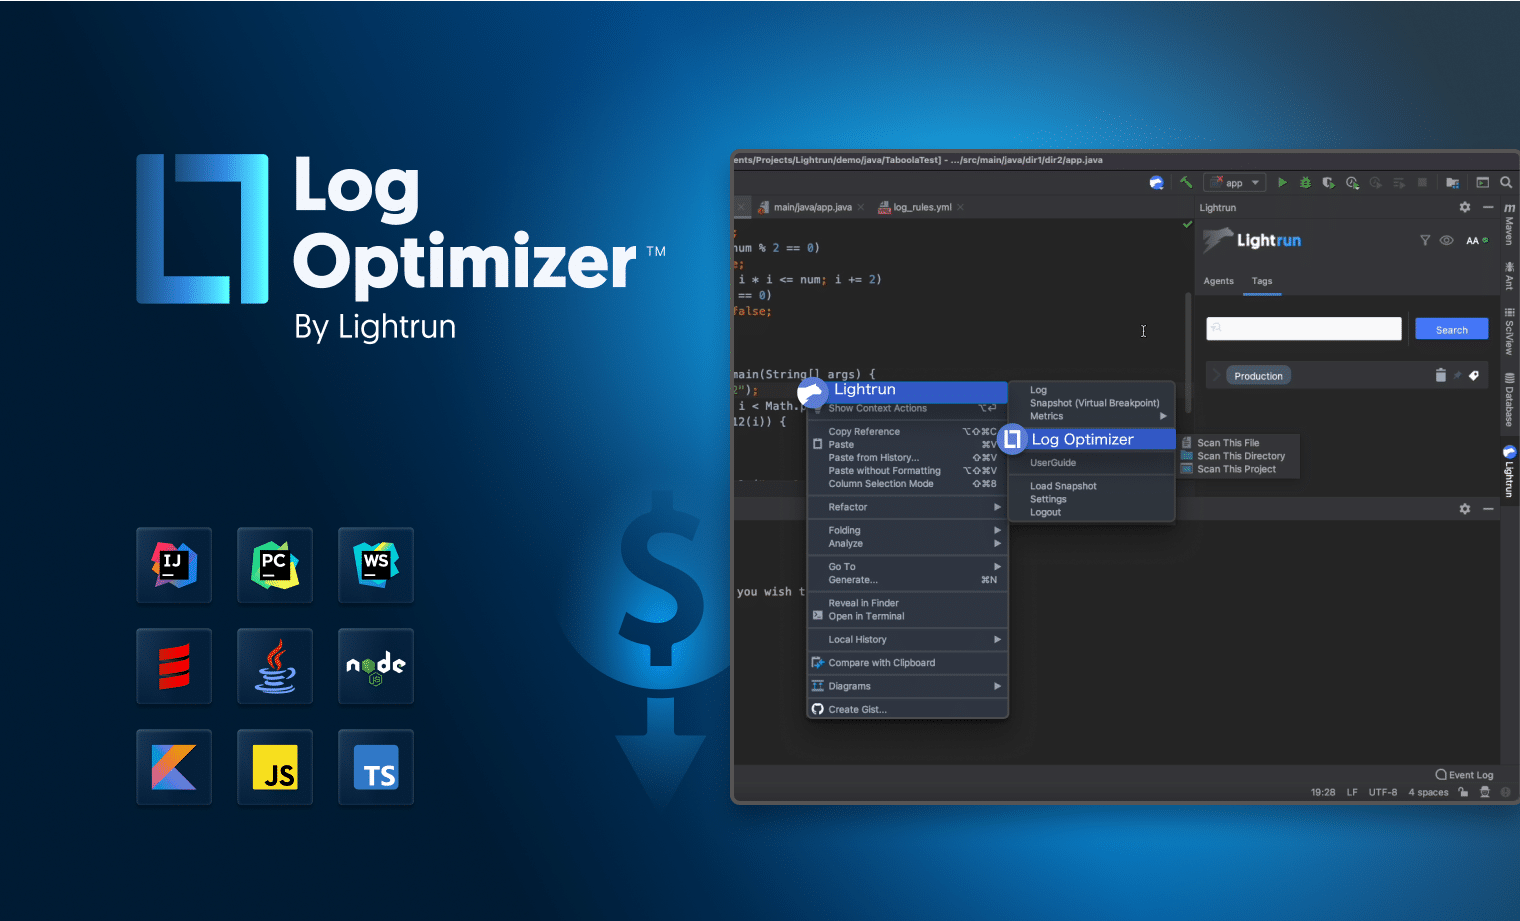
To solve such problems and help developers better understand the correlation of static logs to the overall cloud costs, Lightrun is happy to introduce the Log Optimizer. This new solution is a revolutionary automated log-optimization and logging cost-reduction solution that is part of the Lightrun IDE plugins. It allows developers to scan their source code (single file or complete projects) for log waste, and get in seconds the log lines that are replaceable by Lightrun’s dynamic logs.
With the new offering, developers can maintain a cleaner code with less static and inefficient log statements, and engineering managers and business management can benefit from a lower cloud bill that’s associated with logging costs. Such collaborative solutions should contribute to a better culture of cost awareness within the engineering group, and support the adoption of FinOps practices throughout the organization.
In this post, you will learn how by adopting the Log Optimizer you can:
- Use logging scanned data inside your IDE to guide you on replacing redundant and static logs with dynamic logs.
- Continuously be aware and accountable for logging costs and understand how to optimize them.
- Realize how shift left of FinOps practices toward engineering can establish a culture of cost awareness.
Gaining Visibility Into Redundant Logs and Eliminating Noise in your Code
The new Log Optimizer solution, comes pre-packaged with Lightrun IDE plugins, and it is an automated log optimization solution that enables developers to scan their source code for log “waste”.
Developers can run a scan of a single source code file or their entire project written in either Java, JavaScript, TypeScript or Node.JS and get an immediate output of recommended log lines to be omitted from the code.
To get started with the Log Optimizer, please ensure you get the latest version of the Lightrun platform, and follow the instructions on the setup page.
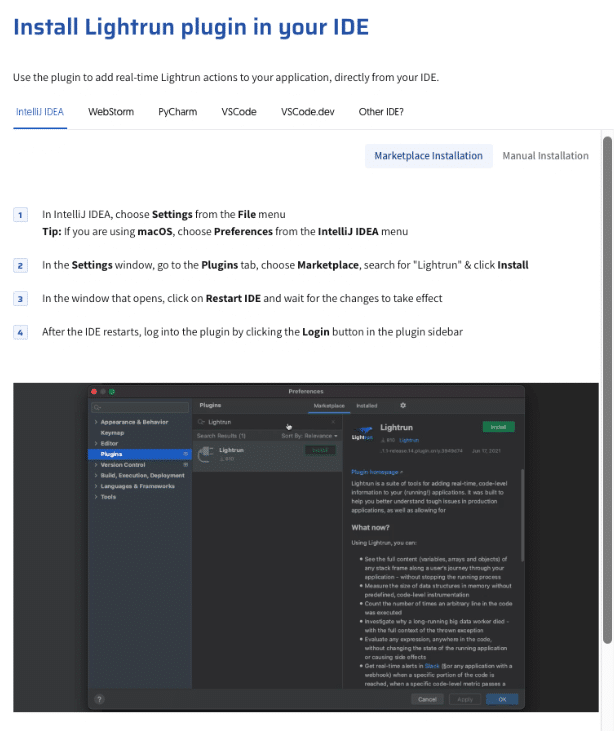
Upon completion of the IDE plugin installation and the authentication steps, you should be ready to go.
From your project folder in the IDE (e.g. IntelliJ Idea), run a Log Optimizer scan for either a specific java source file or the entire project directory (see illustration of the supported scan types of the solution).
Keep in mind that to run the solution, you will need to have the Docker client software running on the machine that scans the source code with its ability to download Docker images from the Docker Hub.
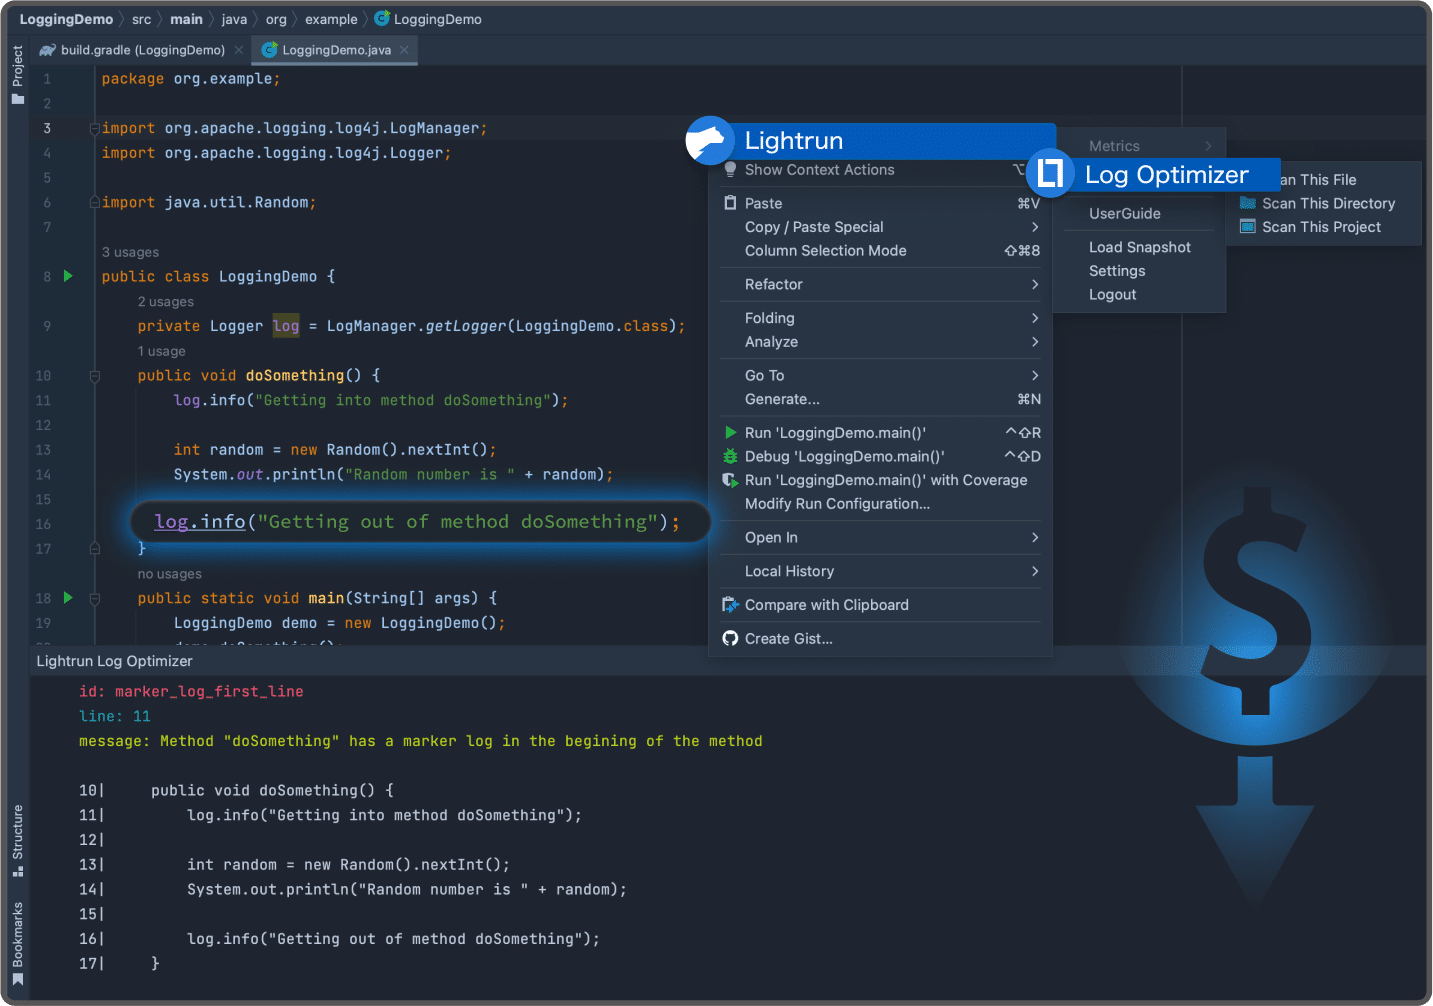
The above add-on to the Lightrun IDE plugin allows you to continuously scan your projects as you add more logs and code into it. The scanning action results in a detailed log optimizer scan output that you can review and analyze in the dedicated Log Optimizer IDE console (see examples below).
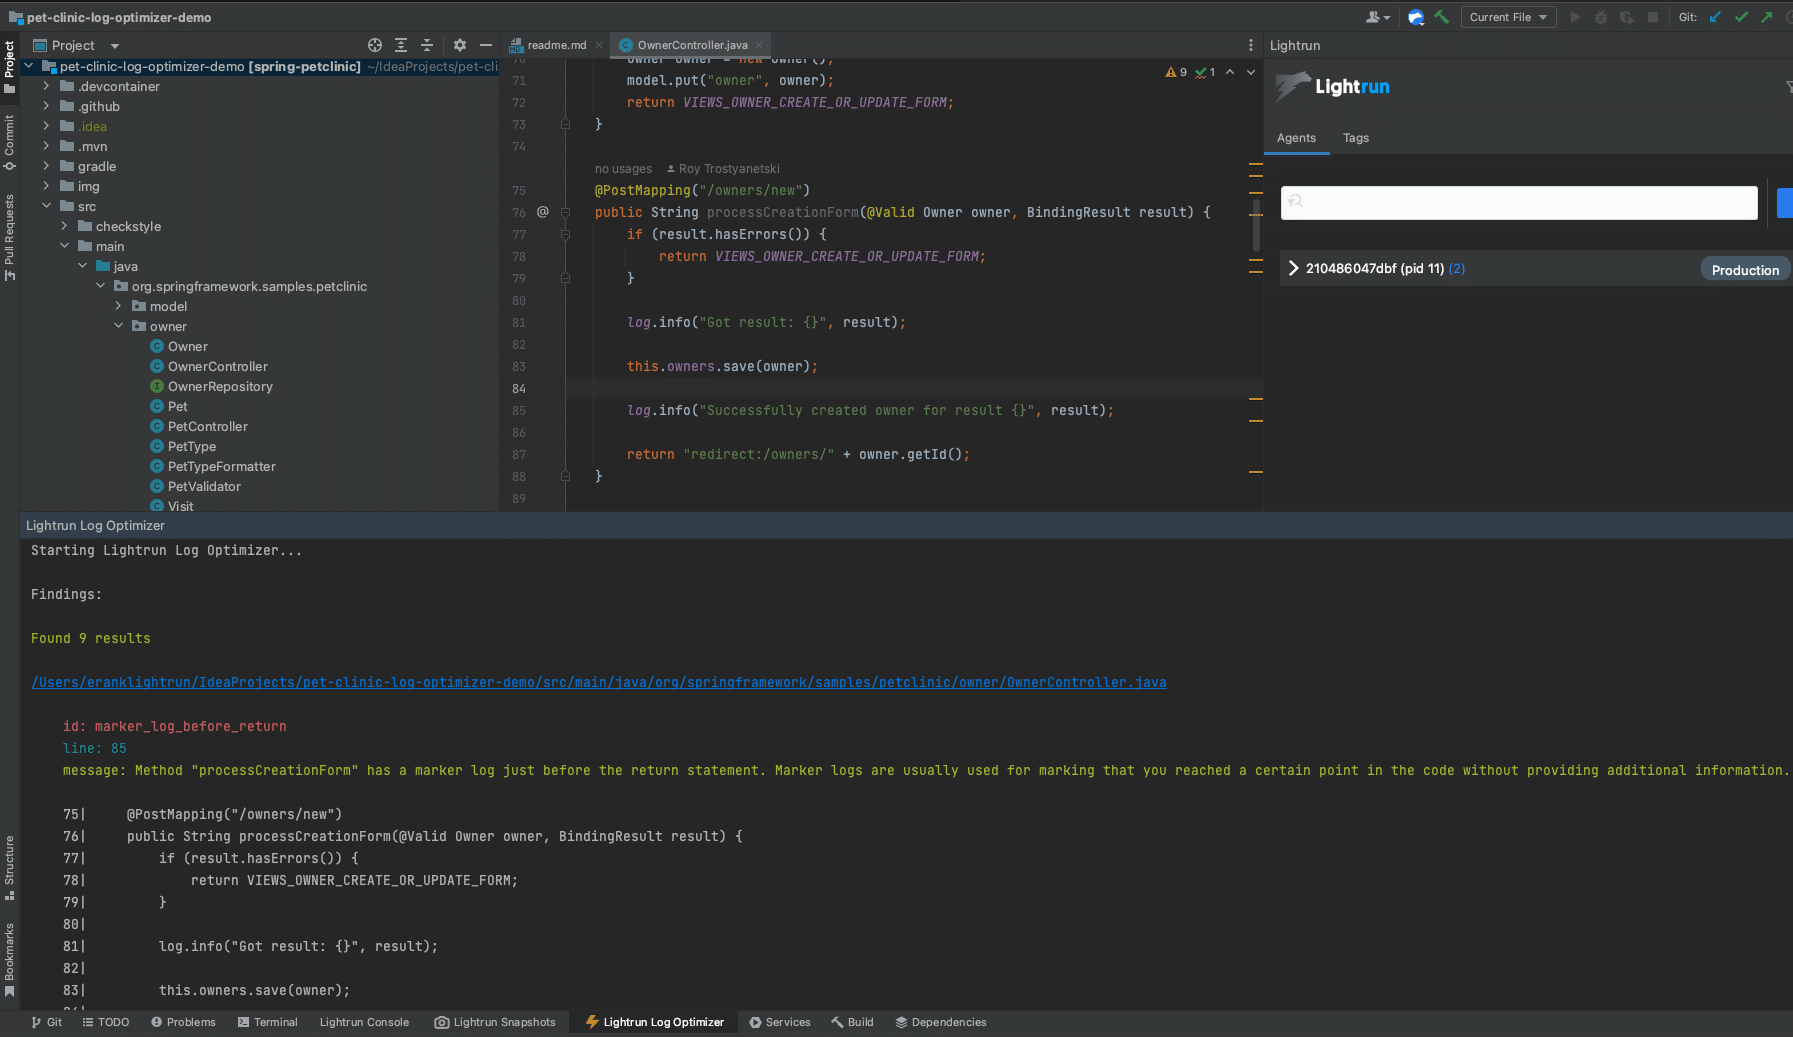
Upon a Log Optimizer scan of a single Java source file, a developer will get as an example the following output to the IDE dedicated console.
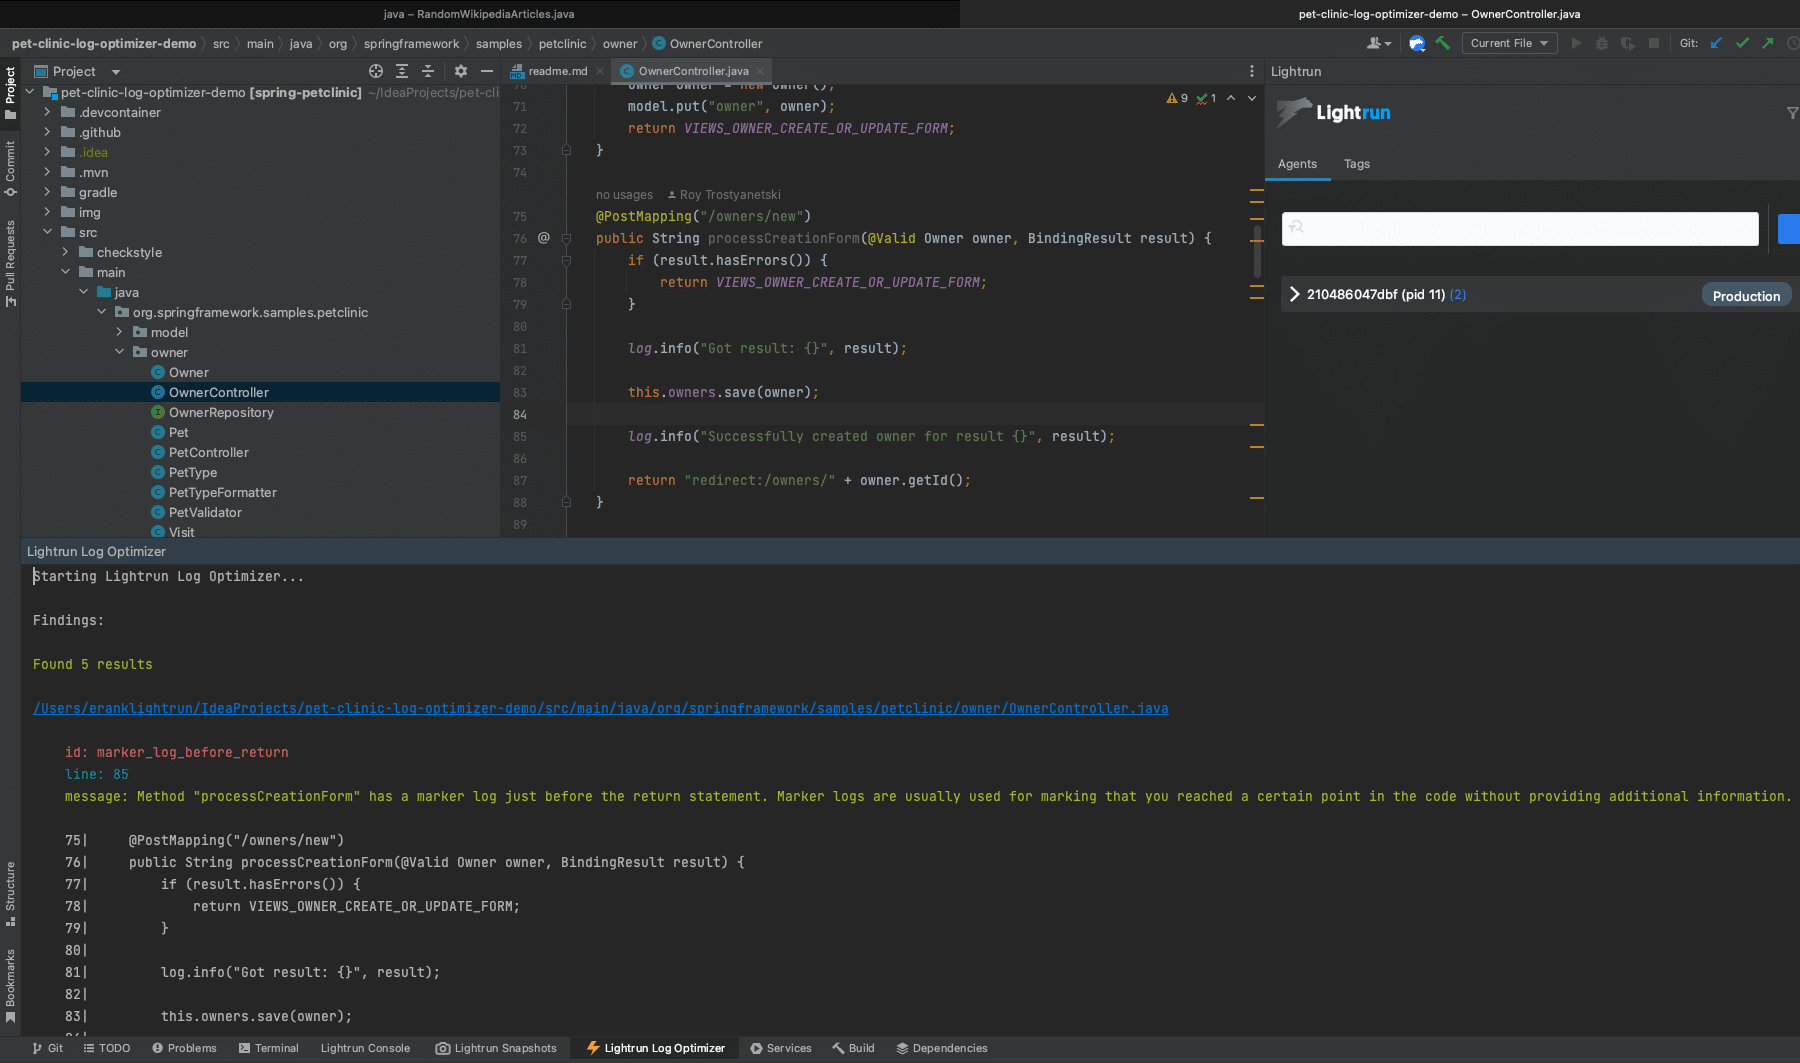
As you can see, the single Java source file ‘OwnerController.java” has 5 logs that can be omitted from the source code and save the team money on redundant logs, as well as contribute to a cleaner code. The Log Optimizer detected in the above class in line 85 a marker log that is only used for marking that the software reached a certain point in the code. This specific log does not provide new information or insight as part of a troubleshooting process, hence, can be removed. Other examples for logs that can be replaced with dynamic ones or improved and were spotted in the same Java class are logs that contain multiple instructions and are not merged into a single log statement.
With the above in mind, when the Log Optimizer™ is executed on the full Java project, the output showcases a complete scan results with potentially more opportunities for log optimization actions. As can be observed in the below screenshot, a complete scanning output of the Java project within the IntelliJ IDE on the same PetClinic project was able to uncover 9 unique logs that are candidates for exclusion from the project.
The wider scan has identified more cases for log optimization such as the one in “PetController.java” where the tool detected a log within the method “initCreationForm” that has a marker just before the return statement.
Now that the value of log optimization around cost savings and cleaner source code is clear, the next step is to decide which log lines are going to be removed and be replaced as needed with dynamic logs, and which ones have a justification to remain inside the project. This scanning activity should be an ongoing and continuous process since the code keeps on changing on a constant basis.
Embed Continuous Log Optimization Practice within the Engineering Team
As mentioned above, making engineering aware and accountable for logging costs and providing them with the right tools to optimize such recurring expenses, starts with solutions that are accessible to the developers from their native IDEs and with concrete actionable data.
By visualizing to developers the aggregated redundant log lines in their project, it triggers an action that results in optimization. The best and most recommended practice to make engineering adopt such log optimization tools and techniques is to make this activity be part of the CI/CD per software iteration or release.
By continuous execution of a log optimization tool, developers get used to the practice, and are realizing the value of logging only when needed and where needed within their source code.
Establish a Culture of Cost Awareness within Engineering and Shift Left FinOps Practices
Engineering feels more empowered and accountable for cost efficiency around their activities when they get clear visibility and information around their software deliverables within their comfort zone environment.
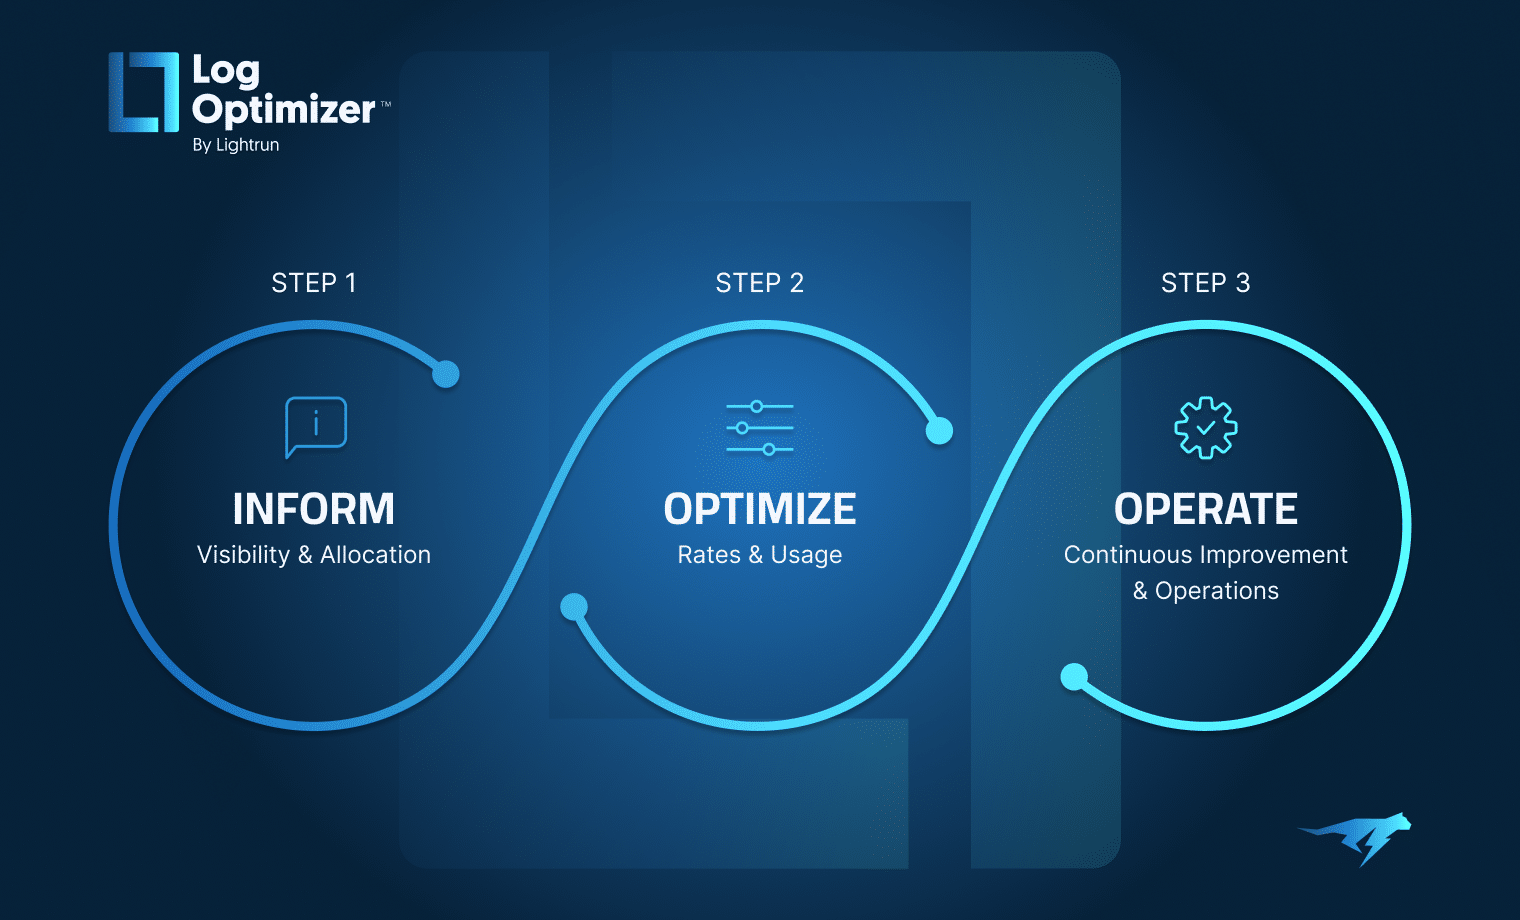
That is why we’ve built the Log Optimizer solution on top of our IDE plugins, so it fully aligns with how developers are already troubleshooting and monitoring their code. With the ability for developers to run on-demand a logging scan on a single source file or on the entire code repository, they are in a frictionless and natural manner adopt a culture of cost-optimization and accountability. That step of awareness and accountability falls under the category of “Inform” within the FinOps framework methodology. With this gathered information, engineering and FinOps teams can move towards the higher maturity phases that are Optimize and Operate, and find the right paths toward cost optimization.
It is an ongoing process, however, as engineers practice and develop a culture of cost awareness, the entire organization can be better aligned, aware, and accountable around FinOps practices and opportunities for cost savings.
Bottom Line
Lightrun’s Log Optimizer solution aims to enable organizations ability to cut on logging costs through a unique visualization of redundant logging data directly within the developer IDE. It is a great step toward enabling both engineering and FinOps teams to break down silos between them; act on optimization logging cost based on pure data; and make this practice a continuous and automated way of developing and delivering new software.
Learn mode from our documentation on how to get started with the Log Optimizer.