The Hidden Challenges of Troubleshooting Legacy and Monolithic apps in Production
Debugging in production is always a necessary evil. No matter how well your code is written and reviewed, bugs are bound to appear, and their consequences are there for your users to see. While debugging any app has challenges, debugging legacy systems is a different ballgame. From unfamiliarity with the codebase to a lack of knowledge about the tech, your developers can find themselves aimlessly searching for solutions where solutions don’t exist.
This article reviews the primary challenges dev teams face when debugging and troubleshooting legacy and monolithic apps in production environments and how to overcome these.
The Challenges in Debugging Legacy Applications
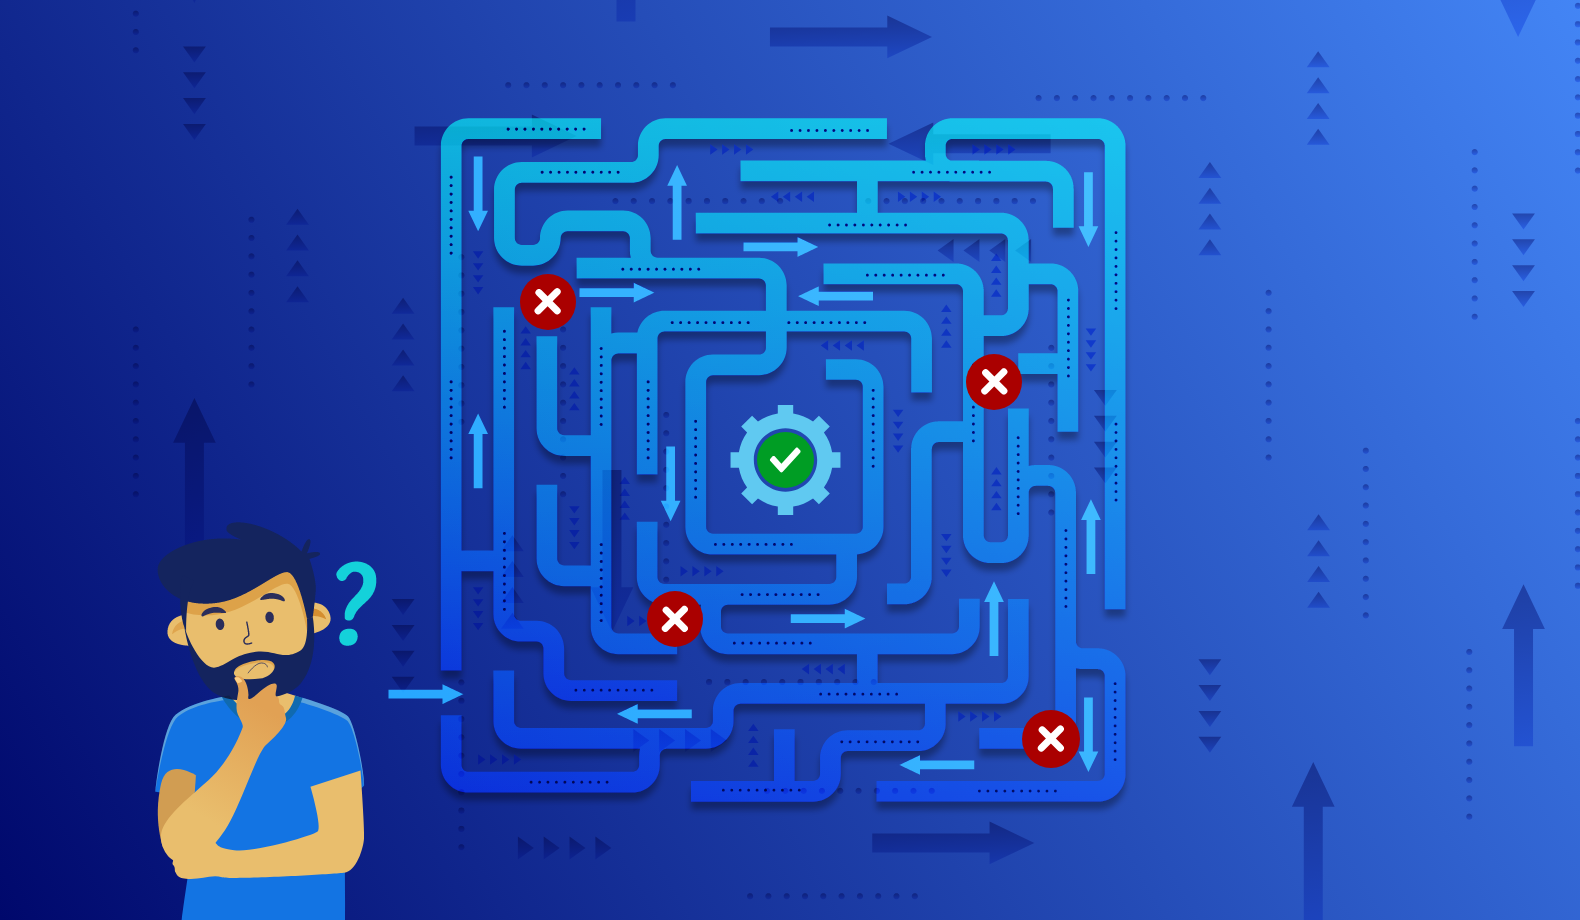
Legacy systems are much more complex than modern systems. Plus, they require different skills and techniques than those used under active development. Any changes made in the runtime environment can cause unexpected maintenance issues that your developers must navigate, all while facing the pressure of an ongoing incident.
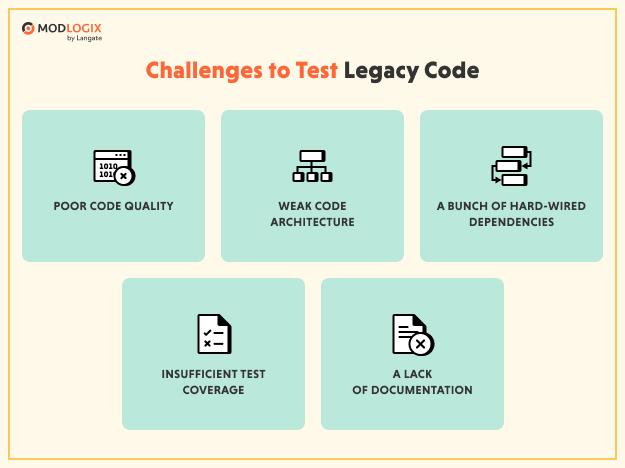
Looking back at the documentation or asking an original developer for help is not the answer either. Legacy apps could have been built decades ago, so the original developers are most likely unreachable, and the documentation needs to be more high-quality to be reliable.
But the show must go on – and the app still needs to work for its users. While there is no magic wand to alleviate the complexity of legacy systems, organizations need to find workarounds and practical approaches that will make their debugging processes as easy and quick as possible.
Why common debugging approaches don’t work
There are generally two possible debugging approaches dev teams can take in legacy settings:
- Local: Running the code on the local machine through a debugger.
- Remote: Using log statements to gain insight into the application in a live environment.
However, the peculiarities of legacy systems can make these approaches insufficient. Let’s explore some of these features and how they impact debugging.
Build Time
Legacy apps generally have long build times, which can slow down the debugging process. If the wait time is too long, developers are more likely to switch contexts or lose focus. With deployment times also being manual and lengthy, this wastes a lot of time and results in potentially missed deadlines.
State Recovery
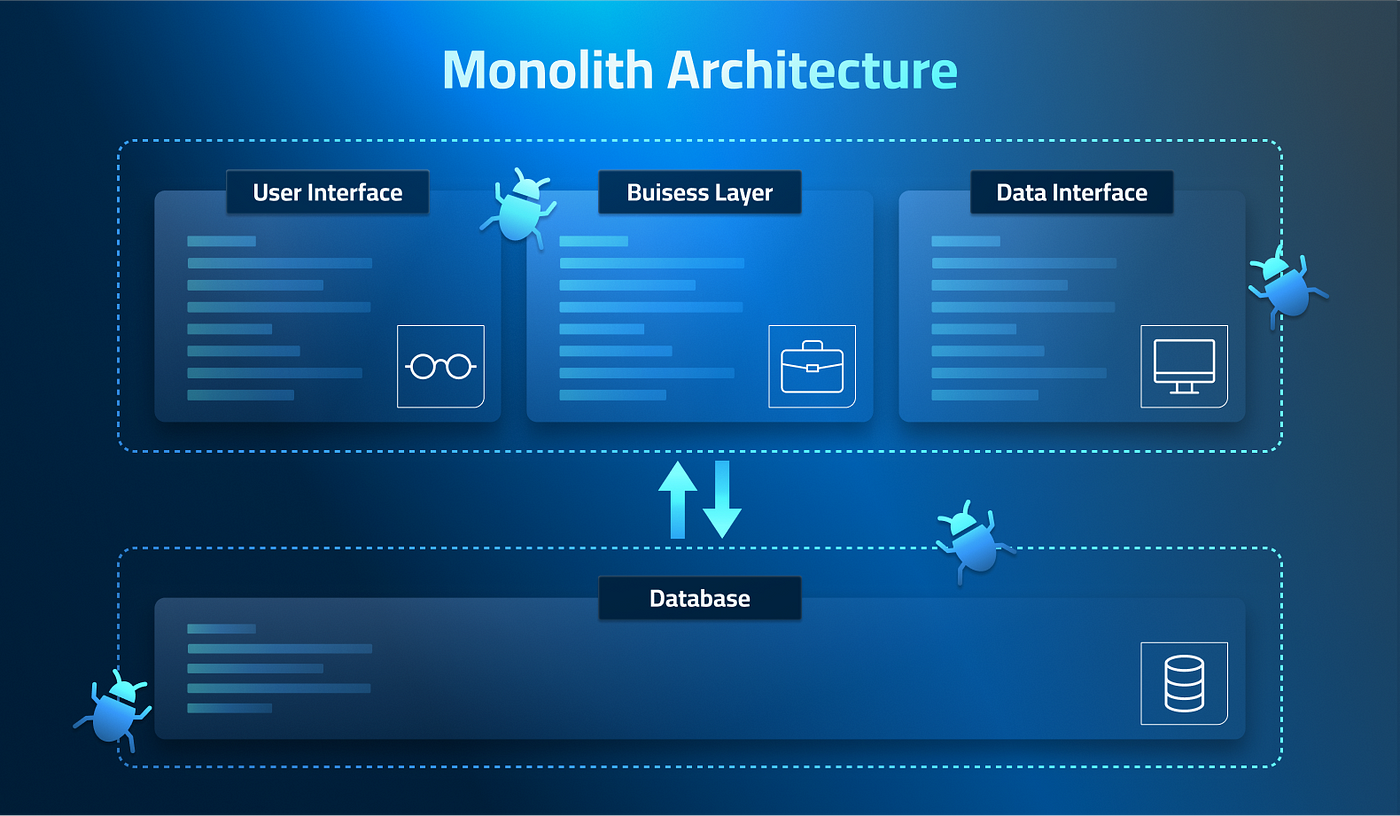
Most legacy applications are monolithic. Because they’re independent of other computing applications, they contain integrated systems such as caches, internal data structures, and connection pools. Reproducing an issue found in production takes a lot of time and is a highly complex task because developers would need to recover the entire application’s state.
Think of debugging database connection pools, for instance. The behavior of a connection pool varies widely from the application start to a long-lived application under production. In the latest case, the pool is more likely to demonstrate erroneous behavior. These long waits to recover the application’s state can severely affect debug cycles.
Dependencies
Legacy code often needs complex dependencies to operate, such as cache engines, databases, and middleware components. Because setting up those services is highly complex, complicating the reproduction of incorrect behavior in the developers’ local environment. Plus, not all dependencies can be reproduced locally.
You need to implement a connection to a test database (provided that such a database exists). Even so, sometimes you can only reproduce a bug if you have access to the production data, which doesn’t tend to happen due to security and compliance protocols.
Restart Time
Monolithic applications can take a long time to start, contributing to further delays in the development cycle. This applies to, for instance, technology stacks that require the restart of an entire application server.
Improving your debugging experience with Lightrun
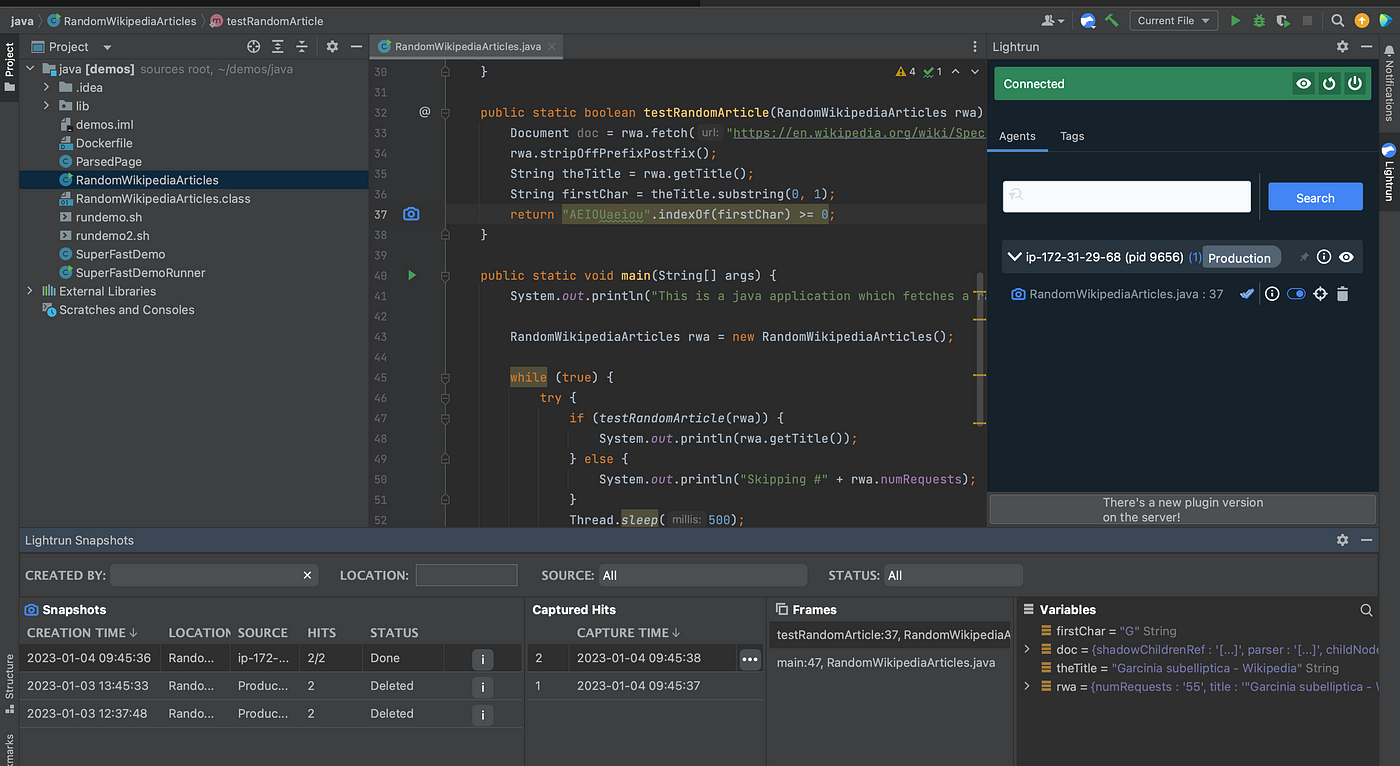
Debugging legacy applications is inherently complex and time-consuming, but tools like Lightrun can significantly improve your processes. Lightrun’s Developer Observability platform enables you to dynamically instrument applications that run remotely on production servers. You can add logs, metrics, and traces to your live app without troubleshooting or restarting the application.
Because you don’t need to rebuild, redeploy or restart your application, you won’t lose your application state, and development time is significantly reduced. Plus, using dynamic insights makes it much easier to improve observability, understand complex and outdated codebases and debug your application efficiently and timely. Lightrun’s features that work particularly well for legacy applications include
- Dynamic Logs enable developers to add new log lines anywhere in the codebase while the application is live. With Dynamic logs, you don’t have to write new code or redeploy the application, and it won’t lose its state.
- Snapshots are virtual breakpoints that can be used on remote applications and provide familiar breakpoint functionalities without affecting execution.
Metrics can monitor live applications in real time and on demand. With metrics, you can, for instance, monitor the size of data structures over time to debug bugs that can be reproduced only on the live system.
And because you can debug remotely with Lightrun, you don’t need to build a complex local development environment that includes all the dependencies – saving you precious time.
Modifying legacy applications can be scary, but it doesn’t have to be with Lightrun. Book a demo or start for free to see the benefits first-hand.
It’s Really not that Complicated.
You can actually understand what’s going on inside your live applications.