A Peek into the Next Generation Observability Solutions
As organizations strive to meet the challenges of digital transformation, they are adopting newer technologies to build more robust software systems. Next generation observability solutions are paving the way to help them meander this maze to deliver better customer experiences and drive business results.
What is Next Generation Observability?
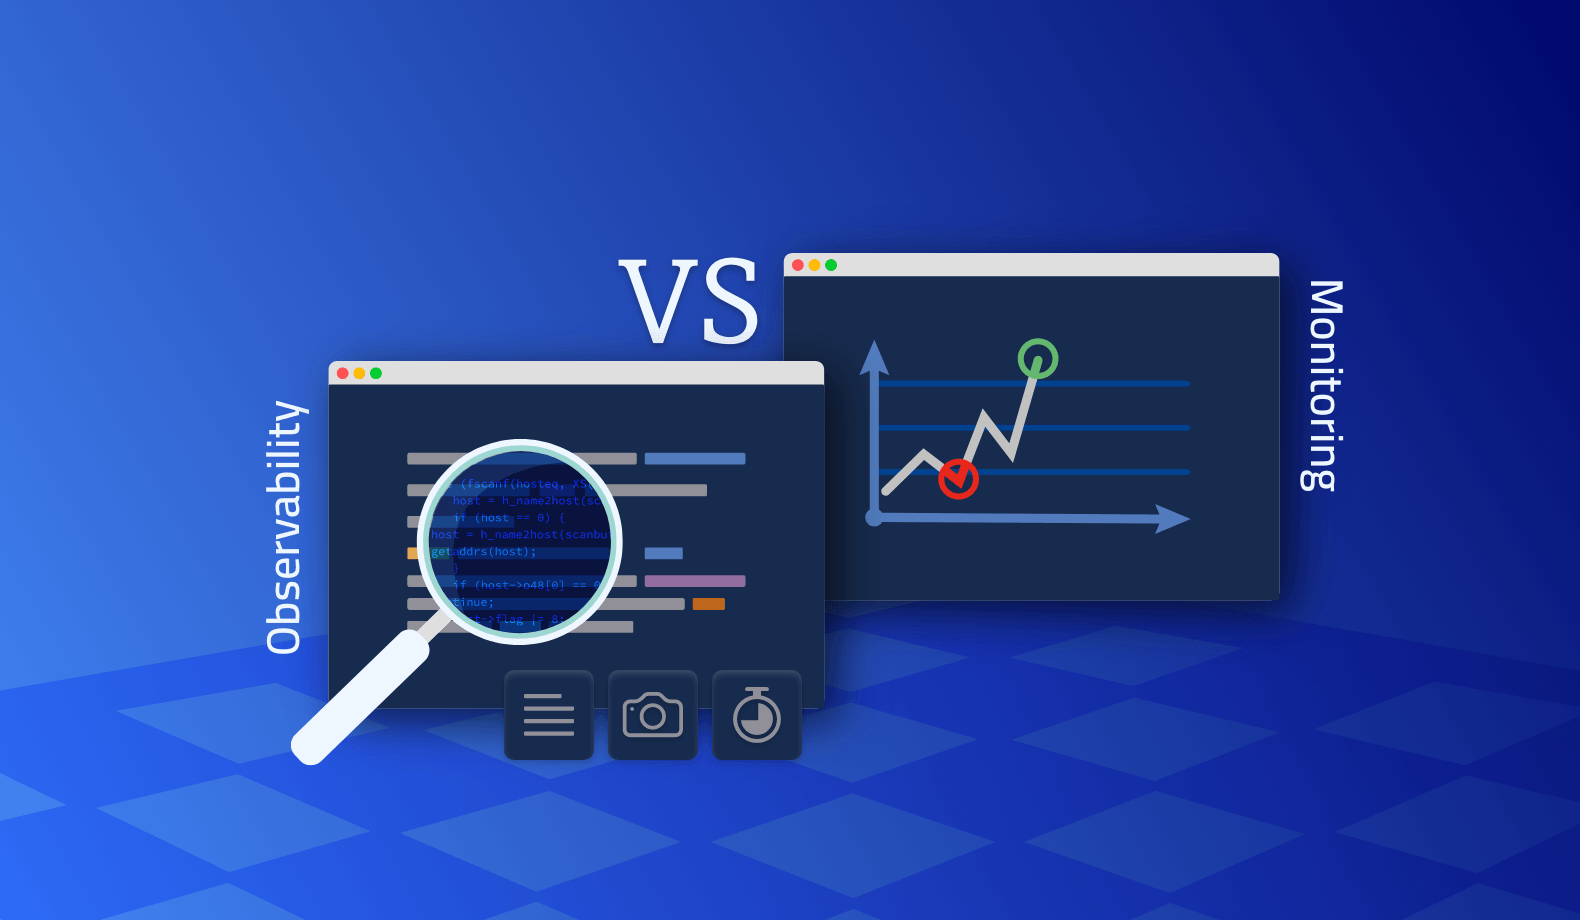
Observability is the practice of monitoring an IT (Information Technology) system to probe its internal state without the need to modify the source code. This approach ensures that any anomalies are detected and diagnosed in runtime, and there is complete visibility into all aspects of the system without requiring any code changes.
Historically, logging has been the most commonly used approach to achieve observability. However, it is not a truly non-invasive approach, since additional logs cannot be added during runtime without altering the source code. The realm of observability begins where the scope of logging ends, and it plays a significant role in the holistic performance analysis of a software system beyond just debugging.

In the context of traditional monolithic software architectures, observability is a much superior approach for runtime debugging. However, given the architecture shift towards microservices, observability’s role expands to cover interlinked software modules in cloud-native deployment environments. Such systems have various moving parts distributed across multiple cloud deployments that require:
- Proactive Monitoring: For a more comprehensive view of the system, which monitors the health of individual components and understands how they interact with each other.
- Advanced Analytics: For collating the data to analyze the overall performance of the system, thereby generating insights across multiple deployments.
- Seamless Integration: To provide better integrations with the tech stack and external monitoring tools.
Next generation observability is a step toward achieving such breakthroughs in a cloud-native application deployment which is the de facto model for building planet-scale web applications.
The Three Directions for Next Generation Observability
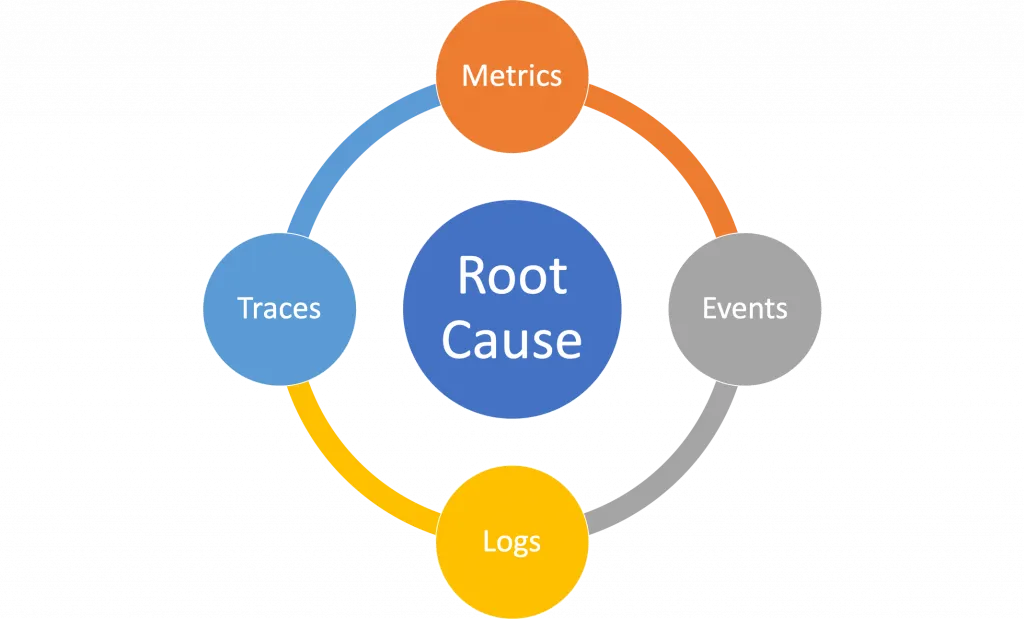
The core notion of observability is the capture of MELT data. MELT stands for Metrics, Events, Logs, and Traces.
Metrics capture the numerical measurements of system performance, such as database query time. Events and logs capture the occurrence of a specific behavior of the system. Traces are detailed records of system activity that can be used to unearth the root cause of errors. Together these four forms of data constitute the recorded output of applying an observability solution to a system.
As systems become more distributed and ephemeral, the traditional approach to observability is untenable for providing the required visibility. MELT data generated from microservices or distributed sub-components are scattered. There is a need to unify this data to draw some inferences, thereby increasing the complexity of integrating observability solutions with the system.
Next generation observability solutions cover the gap between traditional monolithic system architecture and the progression toward a cloud-native, globally distributed deployment architecture. Additionally, it also addresses the specific observability requirements for specialized applications, such as AI/ML infrastructure or payment gateways.
Accordingly, there are a few evolutionary paths for next generation observability solutions.
Newer Observability Features
In the world of observability, MELT data gathering is key to understanding what is happening with your system. Basic observability solutions can all collect and analyze this data. Newer observibility features revolve around:
- Advanced data collation: With the shift towards hybrid cloud and decentralization, collating MELT data from multiple disparate sub-systems is not an easy task. Therefore, one of the areas for next generation observability solutions is advanced data analysis using statistical models or data visualizations.
- Observability with BI: Another area for advanced data analytics with observability data is the integration with business analytics to drive better business outcomes. In this way, observability data helps analyze business application performance, which in turn predicts business performance.
- DevOps integration: Due to the increased focus on software release via continuous integration, and continuous delivery, there is a scope for embedding observability features into the CI/CD pipeline such that it is possible to check system performance at the pipeline, via automated test cases.
Domain Specific Observability
Most observability suites are applicable for general software systems. However, they do not extend well for certain types of software. Artificial Intelligence (AI) based software is one such type. With the rise of AI and ML-based applications, traditional observability solutions fall short since AI and ML observability solutions require a proactive means of observation into the full cycle of the ML models. This includes, but is not limited to, detection of the drifts in model accuracy, skews in input data, and general model performance analysis.
Like AI and ML, certain business processes require specific observability capabilities. Payment processing is one such critical process. It relies upon external integrations to expedite bank payments, in an efficient and automated way. Any time the system fails to process a payment, there is a huge backlog accumulated. A real-time payment observability solution addresses these issues by capturing certain business process-specific key performance indicators (KPIs). In the case of payment observability, the typical KPIs are transaction volumes, average response times, average transaction values, and total transaction value by the merchant.
Deployment Centric Observability
Software deployment architecture has undergone a total transformation in the last few years. A preference for cloud-native applications mainly drives this. From an observability point of view, this shift poses a few challenges, as well as some opportunities to build advanced features on next-generation observability platforms.
- Debugging complexity in microservices: An application built with microservices architecture is much more difficult to debug. That is because it has a highly distributed deployment with hundreds of runtime instances across multiple servers. Next generation observability platforms solve this problem by building intelligent information gathering such that data across all instances are collated and presented to portray a unified system-wide performance snapshot.
- Hybrid cloud: The hybrid cloud deployment model adds a dimension of complexity in the form of edge computing. This approach necessitates additional observability at the edge and collation of data across multiple edge deployments. Next generation observability solutions are gearing up to this challenge by adopting a distributed agent approach, wherein observability data is captured from multiple edge sites via slave agents, and orchestrated by a hosted master agent at a central site.
Observability for Enhanced Developer Experience
Most observability solutions are built with a heavy focus on the DevOps and ITOps side of the operations. They combine tools for monitoring, telemetry, analysis, and a host of other features to manage the observability data. In contrast, the defects identified through observability are mostly routed back to developers. Therefore, along with the experience of operations teams, developer experience with observability solutions is an important consideration.
Continuous Observability
One trend that emerged out of the observability practice is the feedback loop from production to the development environment. After all, any anomalies reported through the observability data in production have to be looped back to development as a potential bug. However, it is easier said than done since replicating issues and capturing logs and metrics in production environments have constraints. But assuming there is a way of doing it, there is a scope to build a streamlined process whereby developers and SRE teams can probe the production environment and get immediate answers, which are fed back to the development cycle.
Lightrun aims to solve this problem by introducing continuous observability in the developer’s workflow. It seamlessly integrates within the software tech stack as well as the developer IDEs and toolchain to provide an interface to generate logs, traces, and metrics, irrespective of the environment. This enables developers to create a better understanding of live application behavior on the fly.
If you are building an application on Java, Python, or Node.js, do give Lightrun a try. You can book a demo to get a sneak peek into the Lightrun platform.
It’s Really not that Complicated.
You can actually understand what’s going on inside your live applications.