Why Real-Time Debugging Becomes Essential in Platform Engineering
Oct 19, 2023 / Updated: Apr 14, 2026

Introduction
Platform engineering has been one of the hottest keywords in the software community in recent years. As a natural extension of DevOps and the shift-left mentality it fosters, platform engineering is a subfield within software engineering that focuses on building and maintaining tools, workflows, and frameworks that allow developers to build and test their applications efficiently. While platform engineering can take many forms, most commonly, the byproduct of platform engineering is an Internal Developer Platform (IDP) that enables self-services capabilities for developers.
One of the notable challenges with building a successful platform engineering organization is that there still exists a big gap between dev and ops teams in terms of the tools and the domains they operate in. While the promise of DevOps is to bridge that gap, oftentimes traditional tools designed by and for operations teams are blindly applied to internal developer platforms, drastically reducing their effectiveness. In order for IDPs to be truly self-service and beneficial for all parties involved, observability must play a key role. Without observability, developers will not be able to gather insights into their applications and debug as true owners of their code.
Important to note that platform engineering comes to serve the wider organization at maximum scale across multi-cloud providers (AWS, GCP, Azure), multi-environments (QA, CI, Pre-Production, Production), and multi-runtime languages (Java, C#, .Net, Python, etc.). Being able to debug and troubleshoot all of the above mentioned configurations and code bases in a standardized way is a huge challenge as well as a critical pillar for success.
As a matter of fact, in a recent article that covers the core skills that are required from a platform engineer, 2 out of the top 8 skills were around developer observability and debugging.
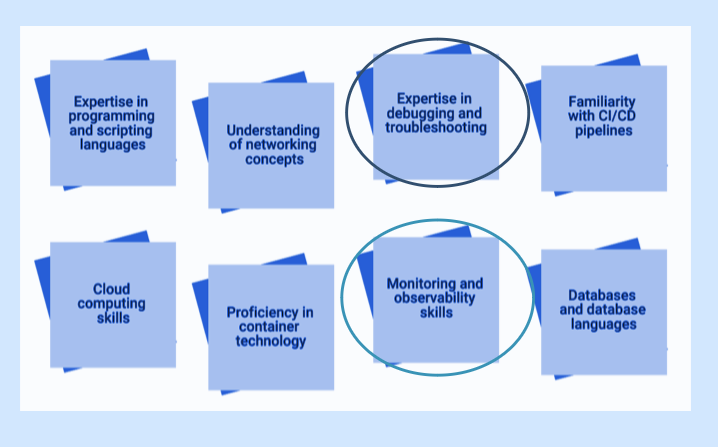
Core Skills Required from a Platform Engineer (Source: SpiceWorks)
In this article, we will explore some of the key components of platform engineering and how they manifest in internal developer platforms. We will then shift our focus to the growing importance and adoption of developer focused real-time observability in IDPs and how traditional observability tooling often falls short. Finally, we’ll look at how Lightrun’s dynamic observability tooling can unlock the true value of IDPs.
Key Components of Platform Engineering
Platform engineering came largely as a response to the difference in the idealistic promises and the stark realities of DevOps in practice. While the “you write it, then you run it” ethos of DevOps sounds good, the reality is not so simple. With the rise of cloud native architectures and microservices, we now have more complex moving components to run an application. It is unrealistic to ask developers to not only write their code but also be well-versed in what traditionally falls under the Ops bucket (e.g., IaC, CI/CD, etc).
So platform engineering is a more practical response to carry on the spirit of DevOps while acknowledging the real-world constraints. Some of the key components of platform engineering includes:
- Promoting DevOps Practices: This includes IaC, CI/CD, fast iterations, modular deployments, etc.
- Enabling Self-Service: Platform engineering teams should enable developers to build and test their applications easily. This touches not only on the build pipeline, but also the infrastructure and other related third-party APIs and services that developers can spin up and connect to on demand.
- Providing Tools and Automation: As a follow up to the first two points, platform engineering teams should provide a collection of tools, scripts, and frameworks to automate various tasks to speed up developer lifecycles and reduce human error.
- Balancing Abstraction and Flexibility: There should be a good balance between abstracting away the underlying infrastructure to support a scalable and performant platform with exposing important metrics, logs, and other observability data points for engineers to troubleshoot issues. In addition, this allows ownership of services by developers (DevOps practice) without the overhead of understanding all infrastructure parts. Basically shifting left to the developers without the cost of infrastructure complexity.
In short, the platform engineering team acts as a liaison between developers and other infrastructure-related teams to provide tools and platforms for developers to write, build, and deploy code without diving too deep into the complexities of modern infrastructure stacks.
Internal Developer Platforms
These principles are best seen in internal developer platforms. IDPs cover the entire application lifecycle beyond the traditional CI/CD pipeline responsibilities. IDPs provide developers with a flexible platform in which they can quickly iterate on testing their applications as if it is done locally. More specifically, this includes:
- Provisioning a new and isolated environment to deploy and test their applications.
- Ability to add, modify, and remove configuration, secrets, services, and dependencies on demand.
- Fast iteration between building and deploying new versions as well as the ability to rollback.
- Scaling up or down based on load.
- Production-like environment with guardrails built in to not accidentally cause outages or degradation in service for other teams.
- Enablement for developers to understand at all times their application costs and allow them to participate and own the overall cost optimization efforts.
In other words, IDPs provide developers a self-service platform that glues together all the tools behind the scenes in a cohesive manner.
Importance of Real-Time Debugging within an IDP
One of the critical components of a self-service platform is observability through real-time debugging. Without exposing adequate levels of observability to the developers, IDPs will remain a black box that will trigger more support tasks once things go wrong, which defeats the purpose of setting up a self-service platform in the first place. Ideally, developers have access to logs, metrics, traces, and other important pieces of information to troubleshoot the issue and iterate based on the feedback.
As such, real-time observability plays a critical role in creating a successful platform engineering organization and a robust IDP. Platform engineers and VP’s of platform engineering that are building IDPs today are investing and prioritizing the need to efficiently collect logs, metrics, and traces and surface the most relevant signals for developers to detect, troubleshoot, and respond to those issues.
Real-Time Debugging within IDP using Lightrun
Lightrun offers a unique solution that aligns with the principles of platform engineering and adds observability in a way that fits with existing developer workflows. Lightrun provides a standard developer observability platform for real-time debugging that allows developers across multiple clouds, environments, runtime languages and IDEs the ability to debug complex issues fast without a need for iterative SDLC cycle and redeployments.
Specifically, provide developers in real time with:
- Dynamic logging: developers can add new logs without stopping or restarting their applications to simply add a new log. This can be added conditionally to only show up in certain scenarios to reduce the noise.
- Snapshots: snapshots emulate what breakpoints would give in a local context. It takes a snapshot of the current execution including environment variables, configuration, and other stack traces at run time.
- Metrics: developers often don’t think about preemptively adding metrics. Now with Lightrun, they can be collected on demand.
These dynamic observability tools are as mentioned integrated into IDEs that developers already use to write their code. Compared to traditional observability tools like APMs or logging aggregators, Lightrun allows developers to add or remove various logs, snapshots, or metrics on demand without having to go through the expensive iteration cycle or adding logs, raising a PR for review, and waiting for changes to take effect. Especially in the context of IDPs, this dynamic approach enables developers a truly self-service method to troubleshoot and debug their applications.
Summary
The rise of platform engineering in recent years has significantly improved developer productivity and experience. Internal developer platforms address a growing problem of increased complexities in developing and deploying modern applications. As more organizations embrace platform engineering and build out internal developer platforms, observability is becoming an imperative tool in standardizing real-time debugging within the IDP tool stack for a truly self-service platform. With Lightrun’s suite of dynamic observability tooling, platform engineering teams can unlock the true potential of IDPs for increased developer productivity.