Debugging Node.js HTTP Requests
HTTP is the backbone of all API-centric, modern web apps. APIs are the place where the core business logic of an application lives. As a result, developers spend a lot of time optimizing the API business logic.
This article addresses a Node.js developer’s dilemma while debugging an HTTP API request. We take a sample Node.js/Express.js-based HTTP service to demonstrate a new way of debugging Node.js applications using the Lightrun observability platform.
First, let’s understand what debugging a standard HTTP request entails in the next section. If you want to jump straight into the Node.js HTTP debugging demonstration, you can skip this part.
Debugging HTTP Requests
HTTP follows a request-response pattern. A client sends a request to the server. The server executes business logic and returns a response. The scope for debugging HTTP requests can be broadly categorized into:
- Debugging Functional Code: Functional code contains the business logic that generates a response by translating HTTP request data to the eventual output returned to the client application, along with an HTTP status code.
- Debugging Non-functional Parameters: Non-functional parameters impact the performance of the server. The most common non-functional parameters are response time, authentication, and session related parameters.
- Debugging Deployment Issues: Deployment-related issues impact the server’s overall health that hosts the backend application serving the HTTP requests. Some of the common problems tracked for debugging these issues include average latency, uptime, CPU/Memory utilization.
Continuous Debugging with Lightrun
For developers, the traditional way of debugging applications is to capture logs. During the development phase, they can edit code for live debugging of the application, running in a local developer environment. However, in a production environment, they are limited to predefined log statements. Adding additional logs involves re-deployment, which has additional process overheads.
Lightrun offers a developer-native observability platform to solve this problem. It provides the agility to perform continuous debugging with a lazy agent that can be attached or detached to the live application at will. Developers can add logs and snapshots to the live application to capture code-specific variables, arguments, or metrics. All of this can be accomplished without touching the source code.
As a result, Lightrun expedites the root cause analysis of any reported bug by directly capturing the application’s internal state.
Setting Up Local Debugging Environment for Node.js
Let’s consider a sample Node.js based HTTP application to take Lightrun for a test drive.
Follow the sub-sections below to set up your local development environment for debugging a sample application.
Prerequisites
- Node.js: Ensure that you have the NVM tool installed on your local development environment. Also, take note to install Node version above v14 via the ‘nvm install’ command.
- VS Code: This demonstration uses the popular VS Code IDE. Install it from the official website.
- Postman: Postman is a popular tool for testing HTTP APIs. Download and install it from the official website. You can also use the popular cURL utility tool for this purpose.
- Lightrun account: Create your Lightrun account. You will be taken through a series of guided steps post the signup. Make sure to choose Node.js as the programming language and VS Code as the IDE.
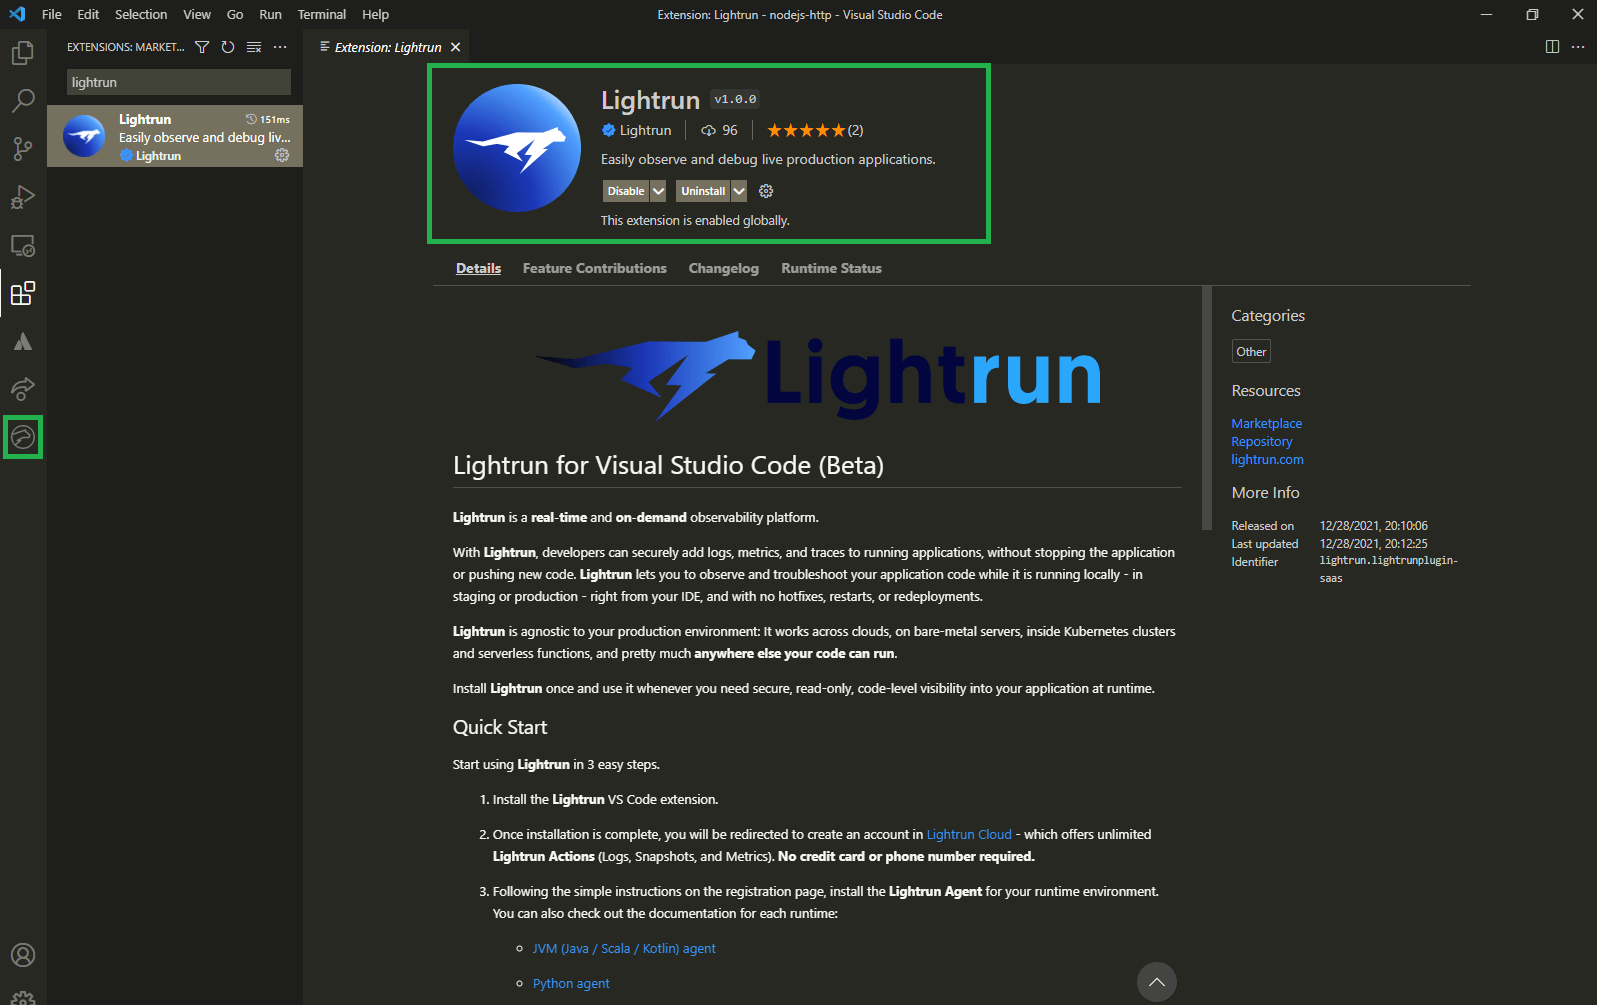
After your Lightrun account is created and VS Code is set up, you should see the Lightrun extension installed and an additional icon displayed on the sidebar of the VS Code IDE.
Note: Lightrun currently supports Windows, Ubuntu, and Mac for Node.js. However, the prerequisites and the subsequent steps shown in this demonstration have been performed on a Windows 10 OS.
A Sample Node.js / Express.js HTTP Service
Now let’s create a sample Node.js application with HTTP service.
Step 1: Create a Node.js empty project
Fire up a command-line terminal. Create a new project directory named ‘nodejs-http’ somewhere under your development environment. Change to that directory and create a new Node.js empty project with the default options.
mkdir nodejs-http
cd nodejs-http
npm init -y
This will create an empty package.json file.
Step 2: Add the Node.js HTTP service code
Open your VS Code IDE and point to the project directory. Next, create a new file ‘index.js’.
Copy and paste the sample code from this GitHub Gist link in the file.
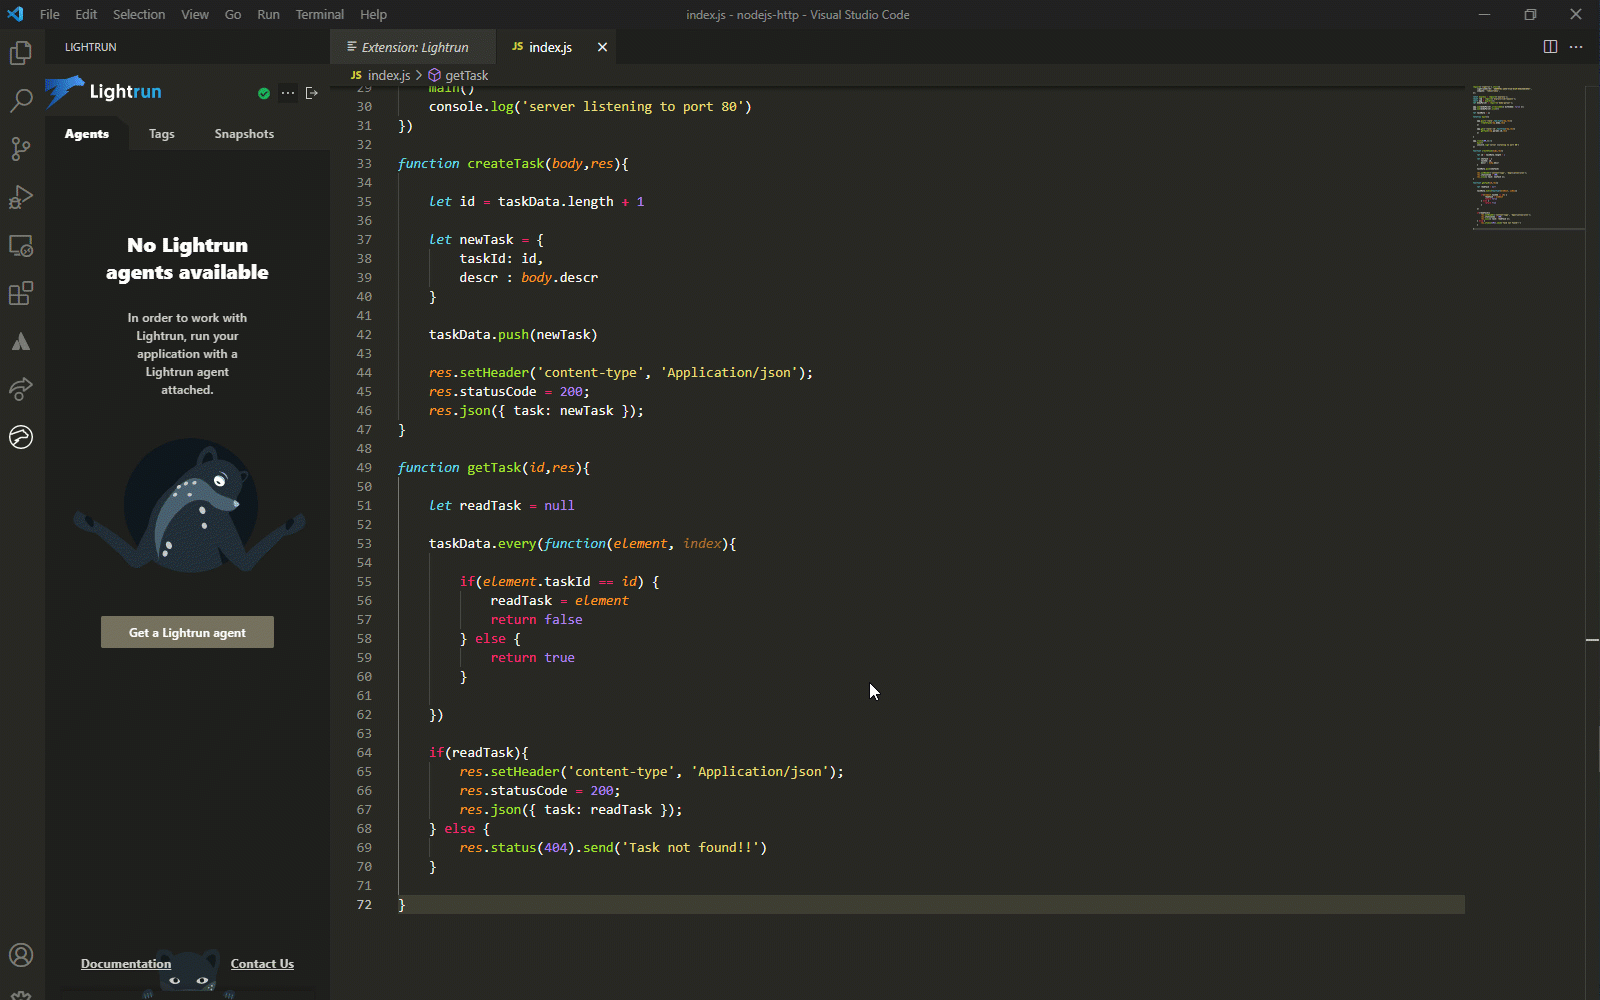
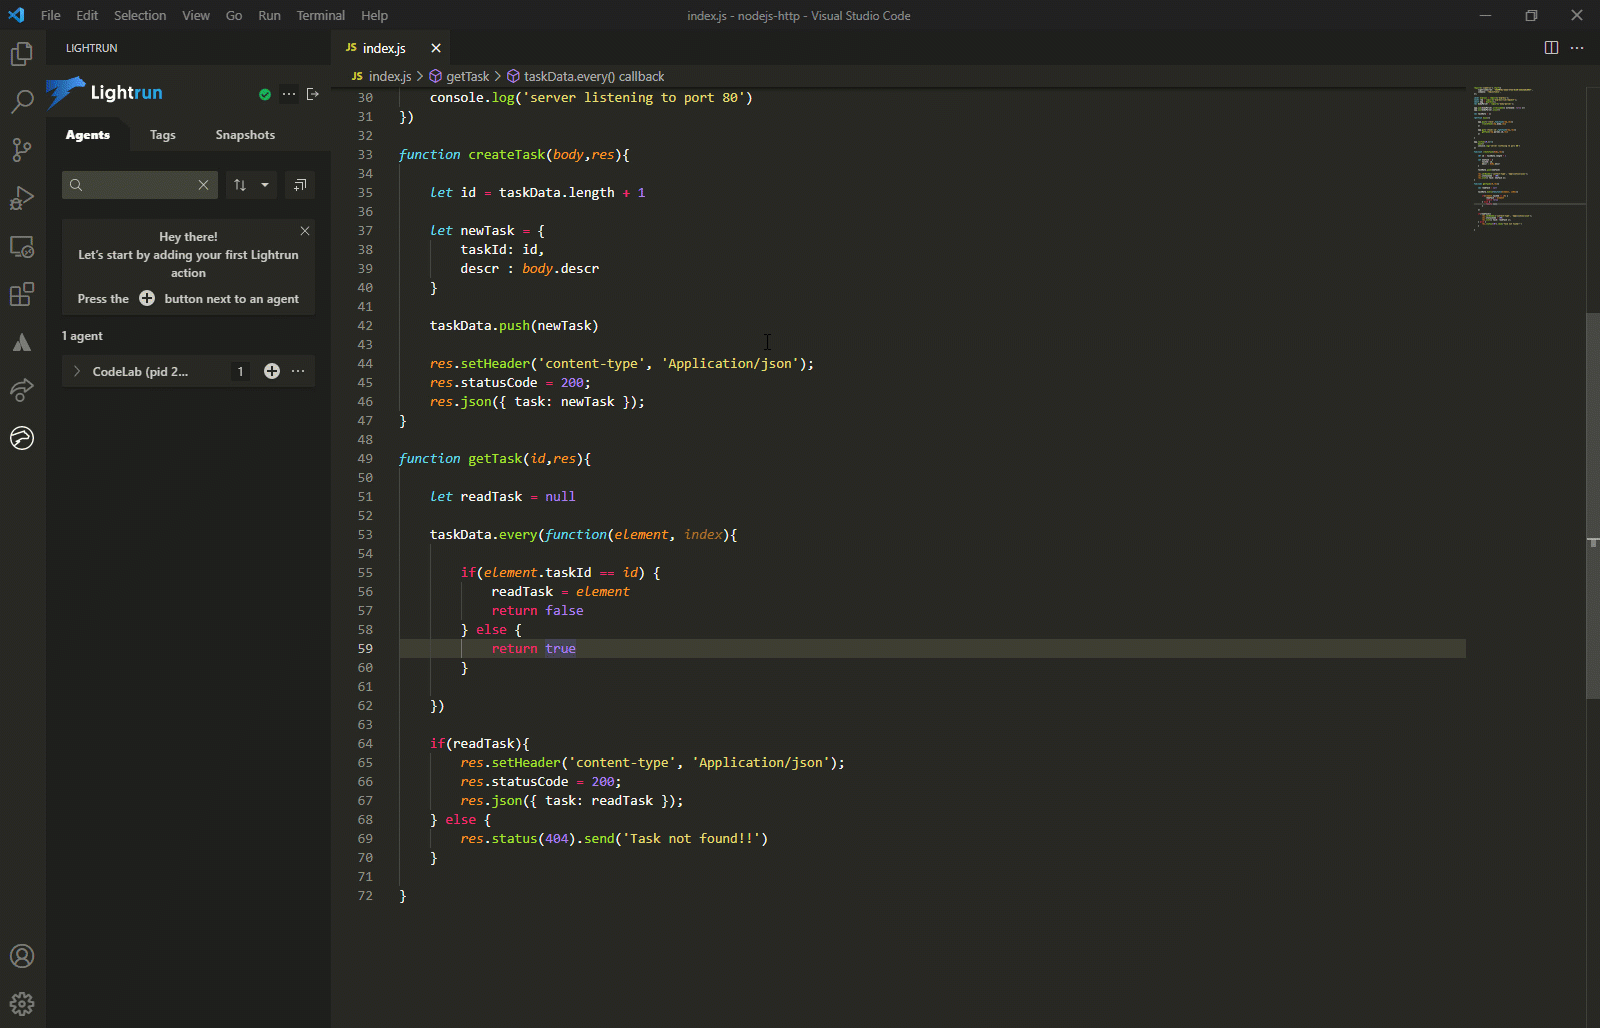
This code contains a straightforward Node.js/Express.js API service which defines two HTTP API endpoints for a basic task management service:
- ‘/POST /task’ : Adds a new task with an id and a description. The id is generated internally, starting with one and incremented for every new task created.
- ‘GET /task/:id’ : Retrieve a task based on its id.
Note: For this sample application, we have used a simple business logic without incorporating Express.js routing features, HTTP authentication or database access. This is done to keep things simple. This code is only used to demonstrate the debugging capabilities of Lightrun and should not be considered for real world deployment.
Take note of the Node.js specific account credentials for your Lightrun account at the beginning of the source file.
require('lightrun').start({
    lightrunSecret: '<YOUR_LIGHTRUN_SECRET>',
    company: '<YOUR_COMPANY_NAME>',
});
It contains two placeholders. <YOUR_LIGHTRUN_SECRET> is the unique key assigned to your account, and <YOUR_COMPANY_NAME> is the name of your company that you entered while creating your Lightrun account.
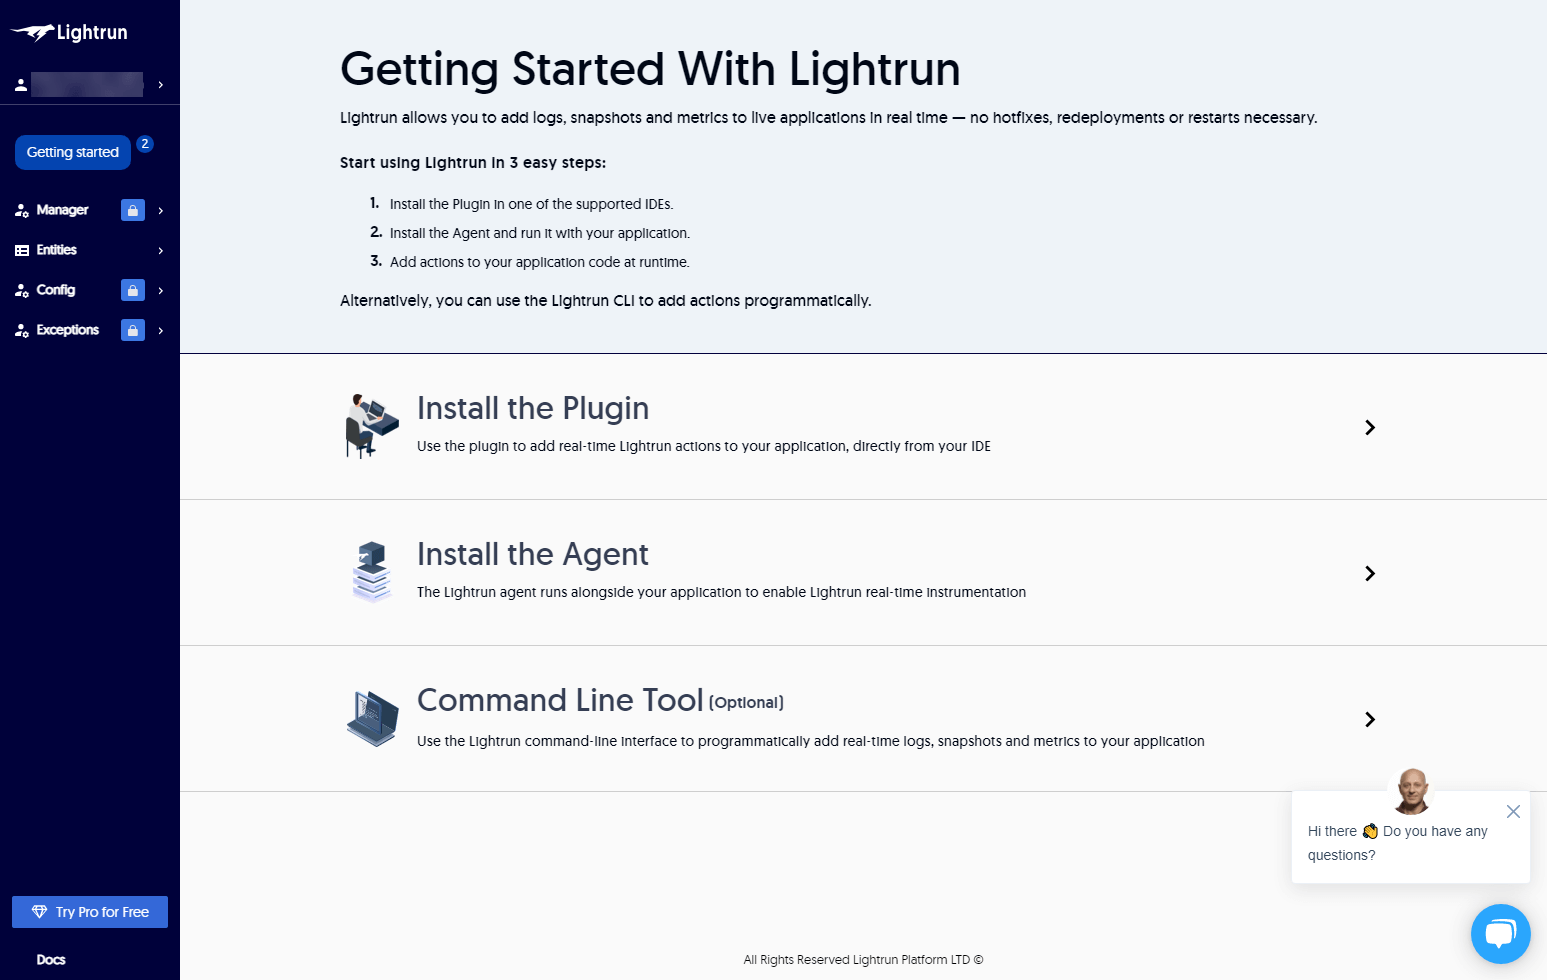
Make sure to replace the placeholders <YOUR_LIGHTRUN_SECRET> and <YOUR_COMPANY_NAME> with your Lightrun account credentials. This is available on the home page of the management console, under the “Install the Agent” section.
Update the source file with credentials, save it, and you are ready to start debugging with Lightrun.
Step 3: Activate Lightrun in VS Code
Activate the Lightrun panel on the VS Code IDE. If you are not logged in to the management console, you will be prompted to do so.
Step 4: Install Node.js Project Dependencies
Before running the application, install the Express.js and Lightrun dependencies using npm. Run the following commands in the terminal, under the project directory.
npm install express
npm install lightrun
Step 5: Run the Node.js HTTP Service
Now you are ready to launch the service. Run the following command on the terminal.
node index.jsThis will launch the task management API on https://localhost:80. Switch back to the VS Code IDE, and you will be able to see the Lightrun agent running on the Lightrun panel.
The Lightrun agent runs as a lightweight thread within the Node.js V8 runtime. It enables the capture of logs and snapshots from anywhere within the code. Thereby, it gives you the ability to perform debugging on-demand without any changes in the code or runtime environment.
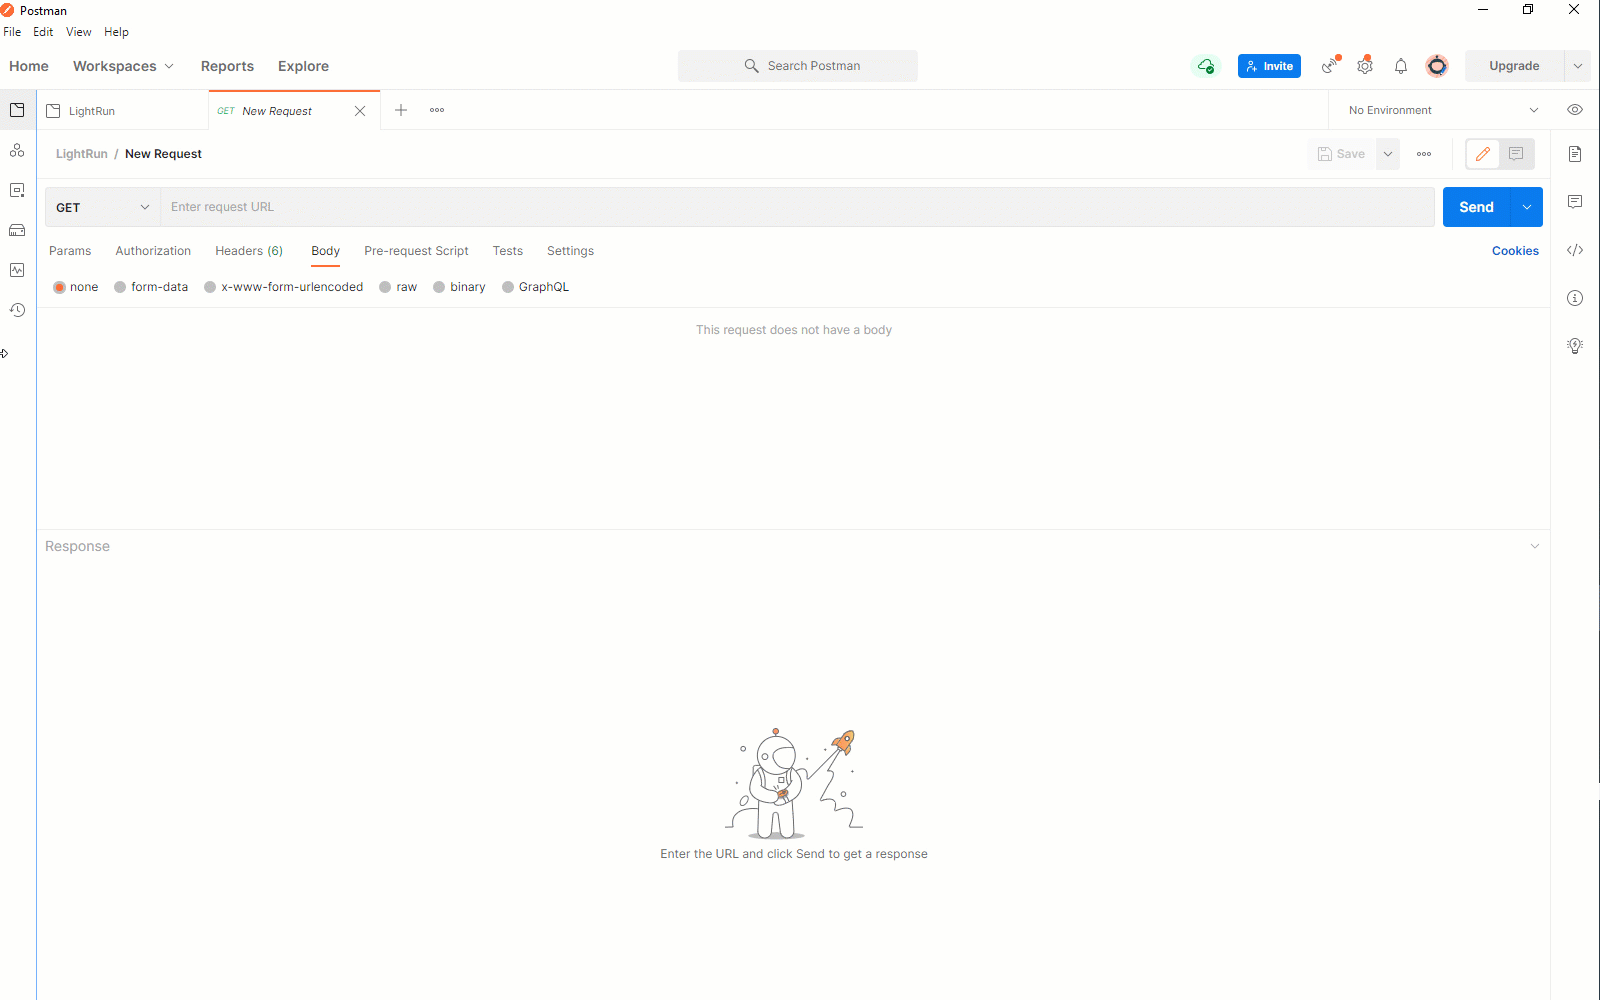
Before proceeding further, let’s do a quick test via Postman to ensure that the APIs are working as expected.
You can add new tasks using the ‘POST /task’ endpoint by sending the following data.
{
    “descr”: “First task”
}
Here we have added two tasks with task ids 1 and 2.
To get a specific task by its id, you can trigger the ‘GET /task/:id’ endpoint, replacing id with the actual task id.
Debugging Our Node.js Application with Lightrun
With the Node.js application running, and the Lightrun agent attached to it, it’s time for you to learn some debugging tricks.
Some of the most common debugging use cases encountered by developers are:
- Functional Code Analysis: This is required for analyzing bugs that cause improper or inconsistent responses from the HTTP service whenever the API endpoint is triggered. Such issues are mostly caused due to:
- Logic errors in the code, or
- Invalid user input triggering a specific combination of the business logic, which was not anticipated previously.
- Performance Analysis: This is required to unearth reliability issues in the system caused by factors that impact its performance. In the case of HTTP service, one of the typical performance issues is the delay of API response.
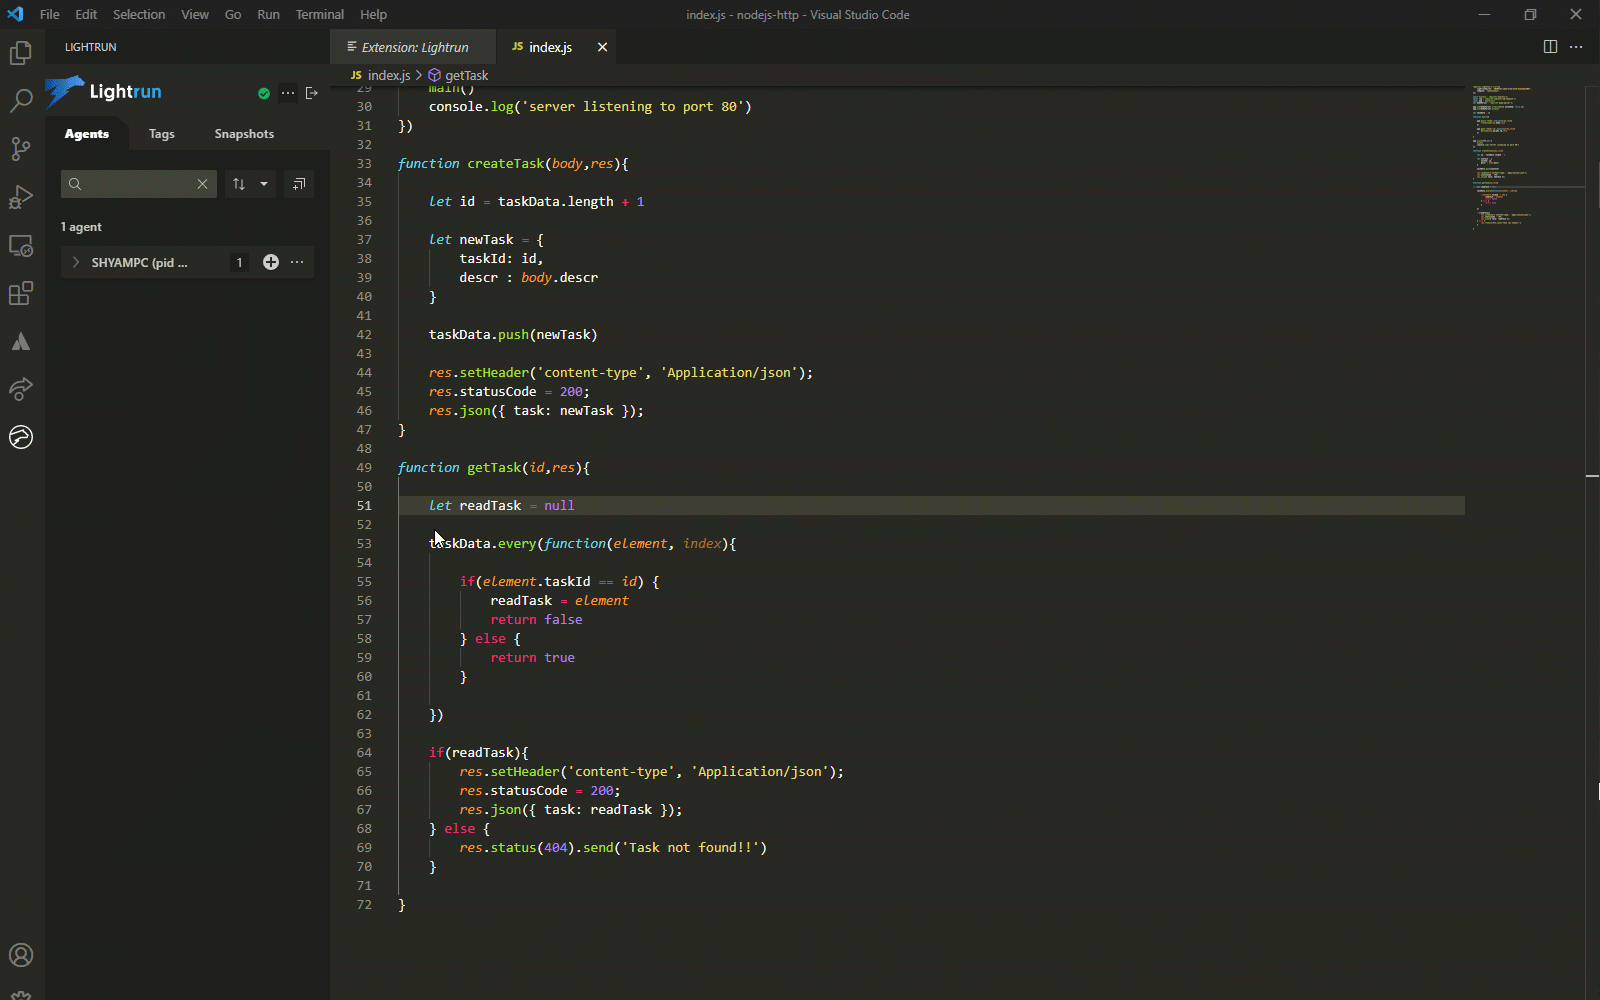
Functional Code Analysis for Node.js HTTP Service
Lightrun allows you to add log statements dynamically in the runtime application, where previously you would have had to edit the code.
Think of the countless ‘console.log( )’ statements polluting your Node.js codebase. Lightrun gets rid of that with a simple action on the VS Code IDE.
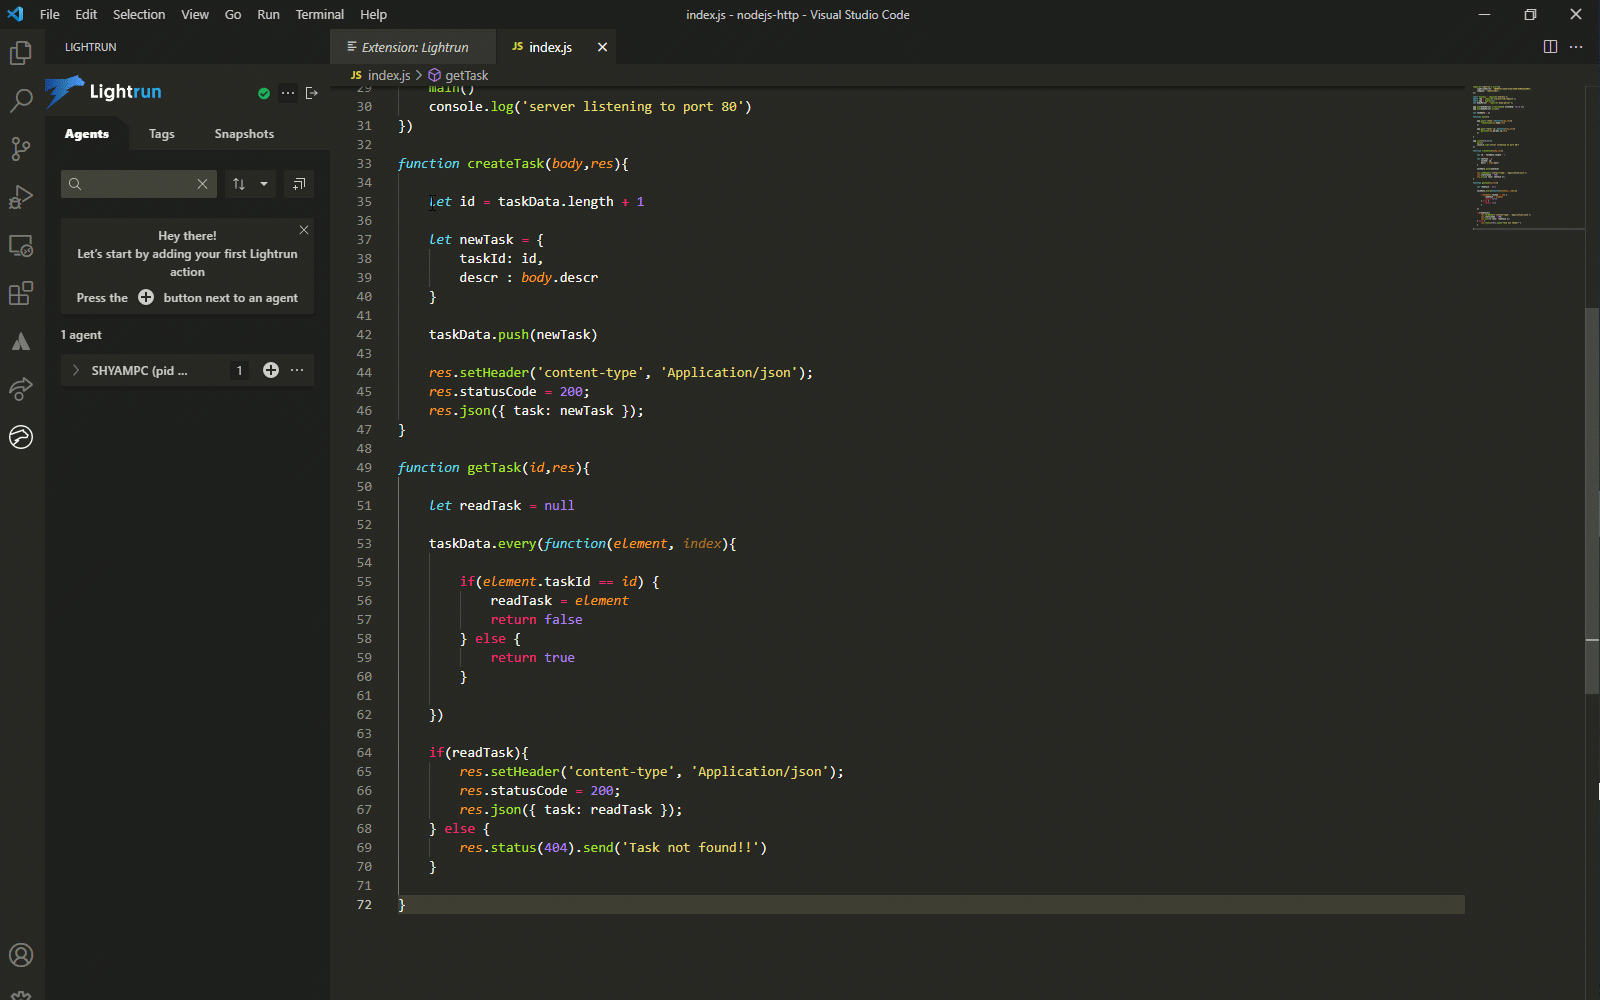
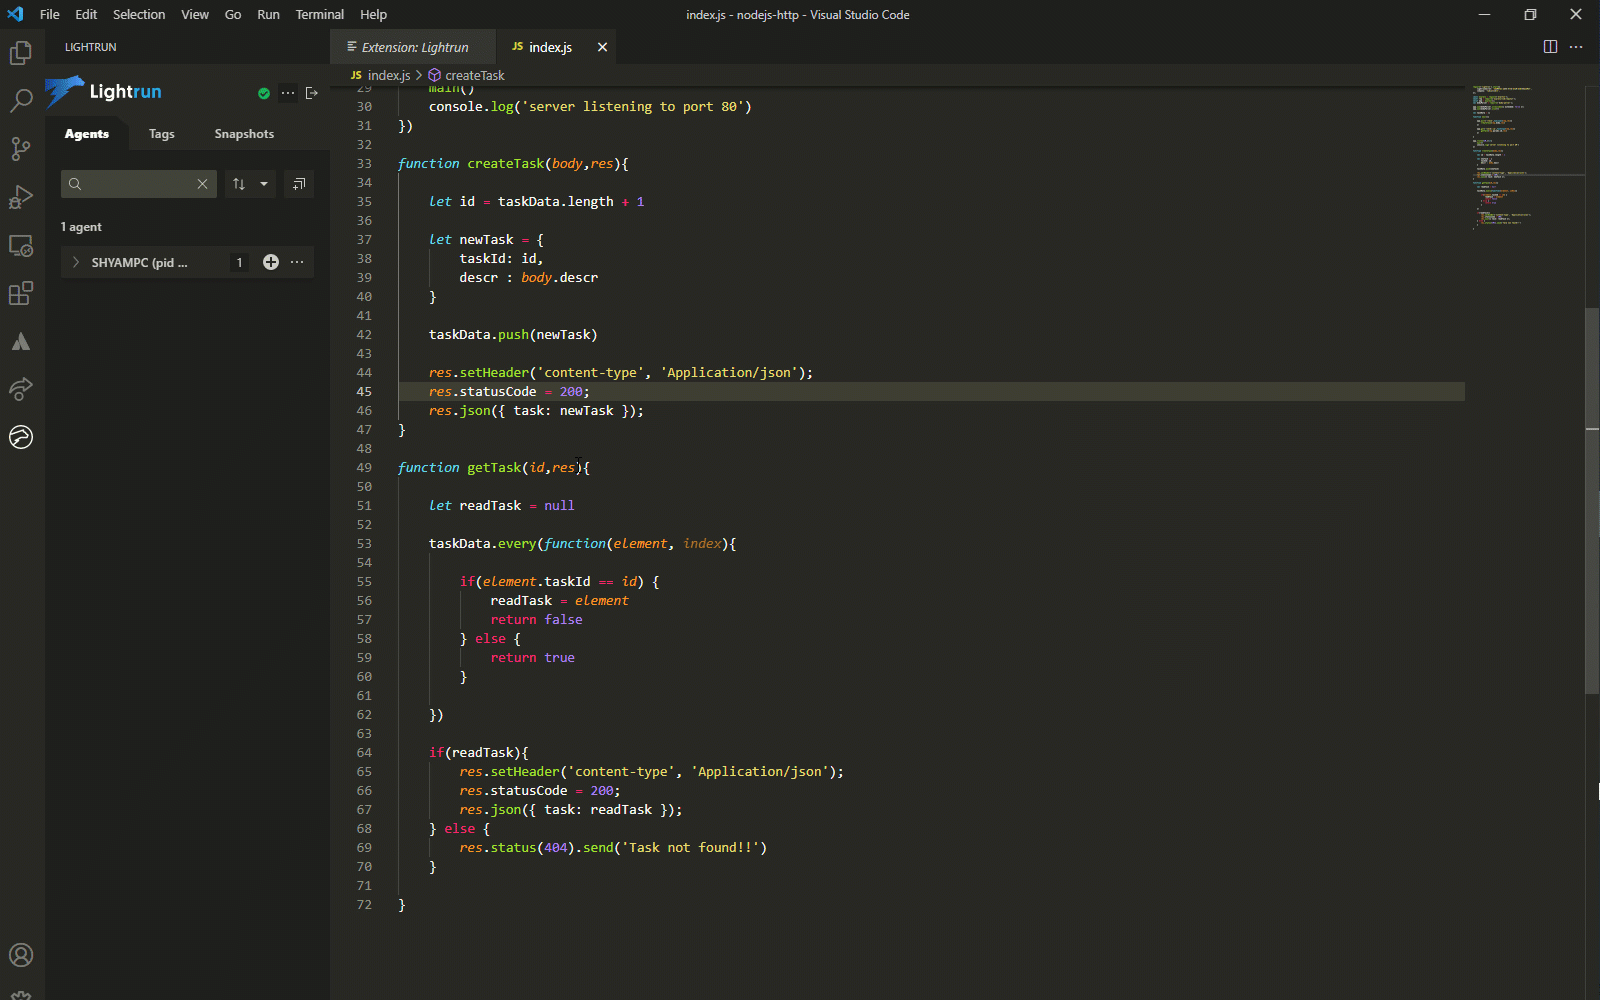
Here we have added a static log message that asserts that the function createTask( ) is invoked when triggered by the ‘POST /task’ endpoint.
But a simple log statement like this only helps you trace the code execution path. What if you want to check the values of variables and arguments?
With Lightrun, you can display logs with values of any variable present within the scope of the line number where the log is added.
Additionally, you can also capture snapshots of the entire stack trace, anywhere in the code.
Here we have added a watch expression to capture the newTask object. The ‘POST /task‘ API is triggered twice to create two tasks, whose snapshots can be examined in the snapshot console. Similarly, you can add more watch expressions and set a hit limit for capturing snapshots up to the specified limit.
The logs and snapshots are part of Lightrun actions that you can add to the VS Code IDE.
Performance Analysis for Our Node.js HTTP Service
Lightrun Logs aren’t limited to capturing the variables and stack trace within the application code. They can also evaluate a legit Node.js/JavaScript expression and display the result as a log message.
This is particularly useful for measuring API performance. One of the simplest ways to measure this is to calculate the delay in responding to an HTTP request.
Using the Date.now( ) utility function in JavaScript, you can add two logs at the beginning and the end of a function to capture the Unix timestamp and derive the time delay in handling the HTTP request.
As you can see above, we have added two logs to indicate the execution time for function getTask( ) which is called as part of ‘GET /task/:id’ endpoint.
The resulting log output suggests that the function execution started at time 1644222340499 and ended at 1644222340523. Therefore, by subtracting the start time from the end time, you can gauge that it took approximately 24 milliseconds to execute the function.
This provides you with a data point to check how performant the API is.
Get Ahead With Debugging On-Demand for Node.js HTTP Requests
With this sample app, you can get a sense of how Lightrun saves you countless hours spent recreating the environment, reproducing the bug, and performing the root cause analysis.
This demonstration uses a local development environment based on the VS Code. Lightrun also allows you to add logs and analyze the code running on a remote server using a CLI in the most non-invasive way, be it a remote server, K8 or a serverless environment. Moreover, you can also integrate with external log analysis tools such as Datadog and Splunk to build your custom observability analytics dashboard.
We will soon add metrics, such as counters, timings, and system stats, to make debugging more exciting within the Node.js Lightrun agent. These features will let you use Lightrun more effectively for functional and non-functional debugging.
Signup for the Lightrun beta program and stay tuned for more tutorials describing the use cases for advanced features coming soon.


It’s Really not that Complicated.
You can actually understand what’s going on inside your live applications.