
Remote Debugging: The Definitive Guide
Debugging is a huge part of everyday software development. If you ask a developer what they spend the most time on every day, the answer will probably be debugging. However, the process of finding bugs and errors hidden in code can sometimes be quite tedious and difficult.
There are many different forms of debugging, and countless tools whose primary purpose is to assist developers in debugging faster. (Full disclaimer: one of these tools is our own Lightrun that helps debug live applications in production.)
In this guide, we will talk about remote debugging: what it is, how it is conducted, and why you should consider using it. We will also cover some methods of remote debugging as well as helpful tips to get started.
What Is Remote Debugging?
Debugging is the process of gathering data from various areas of a project until you figure out the root cause of an error. The next step is to optimize this process so it can be used on a distributed system. This is where remote debugging comes into play.
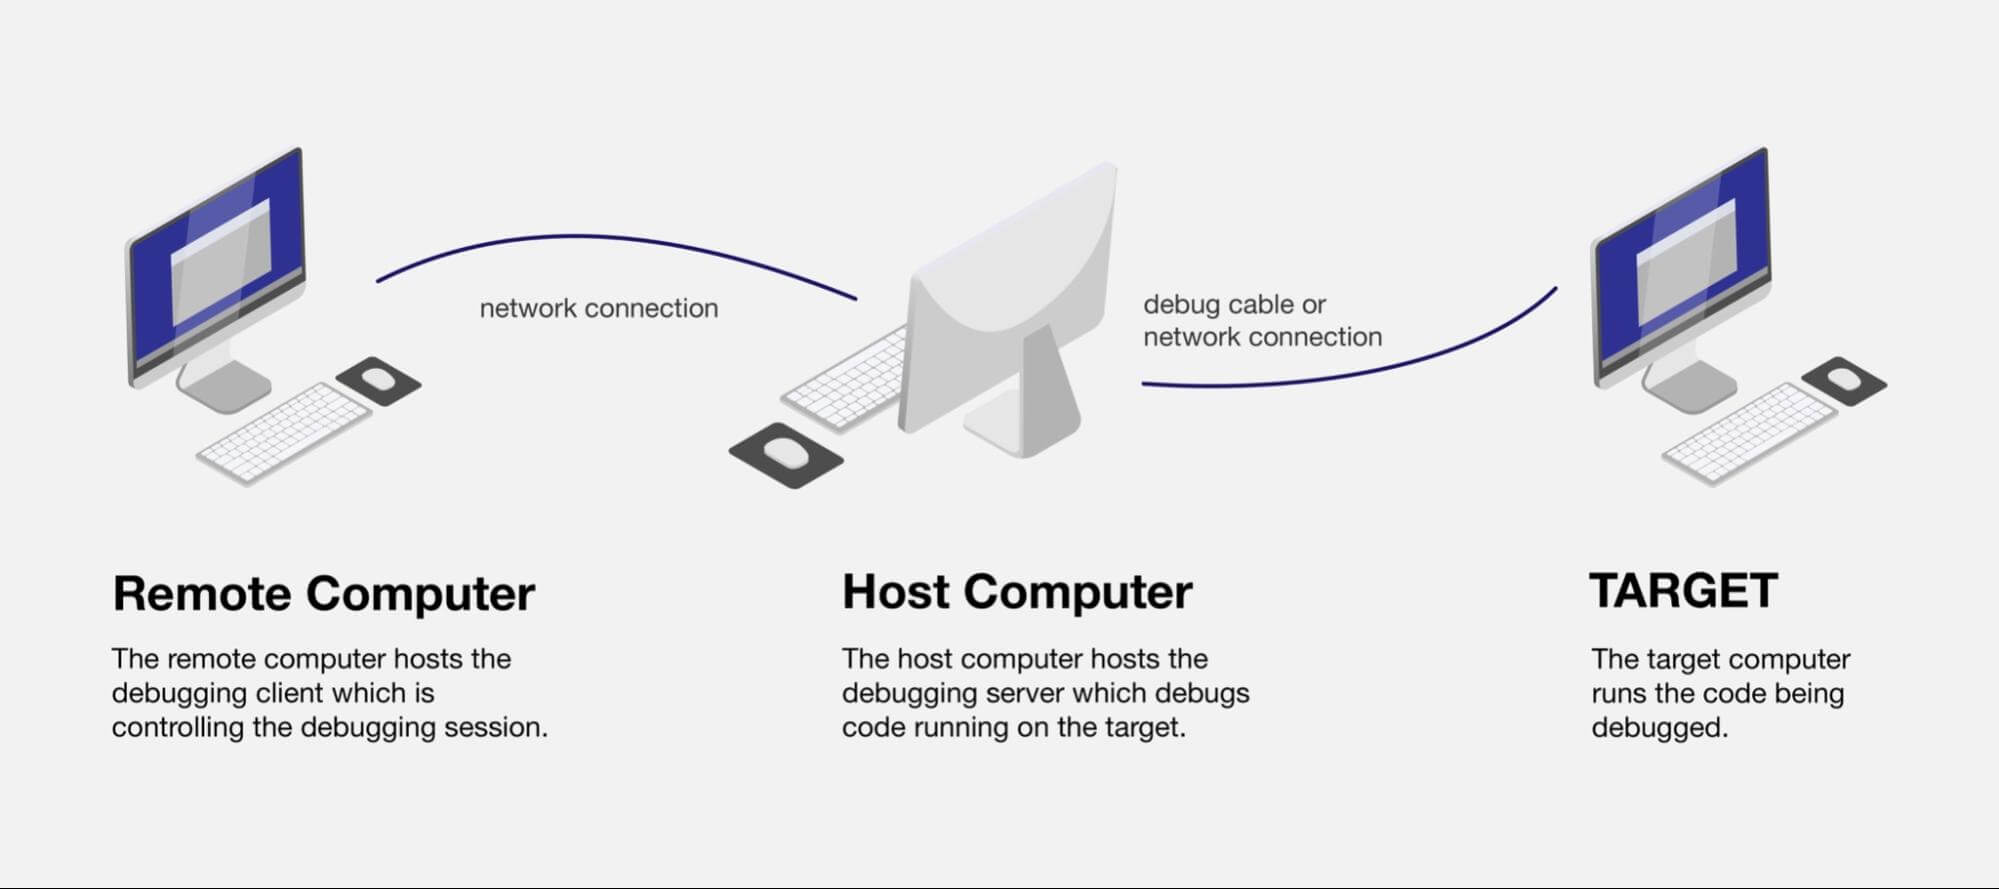
Remote debugging is when you debug an application running in an environment different from your local machine in a way that resembles local debugging. The point of this is for developers to debug components of distributed systems without difficulty. It is essentially the same as opening up a direct connection to the server and debugging directly there.
The size and complexity of current modern systems are astounding, especially in distributed systems. Most big tech companies use the concept of distributed systems: the components of the system are split among many different machines across multiple geographical locations. This gives the system a boost in speed and modularity, but it also makes it more difficult to debug and reason about. The regular debugging process of inserting countless print statements or breakpoints to diagnose the problem doesn’t work, as it would interfere with the running server.
The oft-used alternative is to clone the server’s code, set up environment variables, run it locally, and attempt to replicate the error. However, this alternative is quite time-consuming and replicating the error is usually difficult, which is why remote debugging is the better option.
Types of Remote Debugging
There are two different types of remote debugging: single-client remote debugging and multi-client remote debugging.
Single-client remote debugging, as the name suggests, is when only one client is connected to an application or a server. It is quite straightforward and doesn’t require too much expert maneuvering.
Multi-client remote debugging is when there are multiple clients connected to an application or server at the same time. This can be much more tricky than single-client due to the added complexity. For instance, some errors may only arise when there is more than one established connection to a server, especially if there are many more connections.
At the same time, multi-client remote debugging allows for a more realistic debugging scenario as typical servers establish multiple asynchronous connections with clients. The main difference between the two is that the multi-client type offers the potential for finding more errors due to concurrency and multi-threading.
How Does Remote Debugging Work?
The core principle of remote debugging is to establish a connection with the server hosting the back-end or front-end of the web application. This connection gives developers complete access to the machine on which the server is running. From that point, the developer can install or configure any debugging tools they wish to use.
Establishing this connection can be done in several ways. One of the most widely used connection protocols is SSH (Secure Shell). The SSH protocol offers a safe cryptographic way to gain access to other machines and is the most popular protocol for such a task.
Setting up SSH typically requires generating a public and a private key, as well as credentials that you can use to log in on the machine that you are trying to access. Servers typically have a wide variety of security measures to ensure that not just everyone can access them, even if they have the correct credentials.
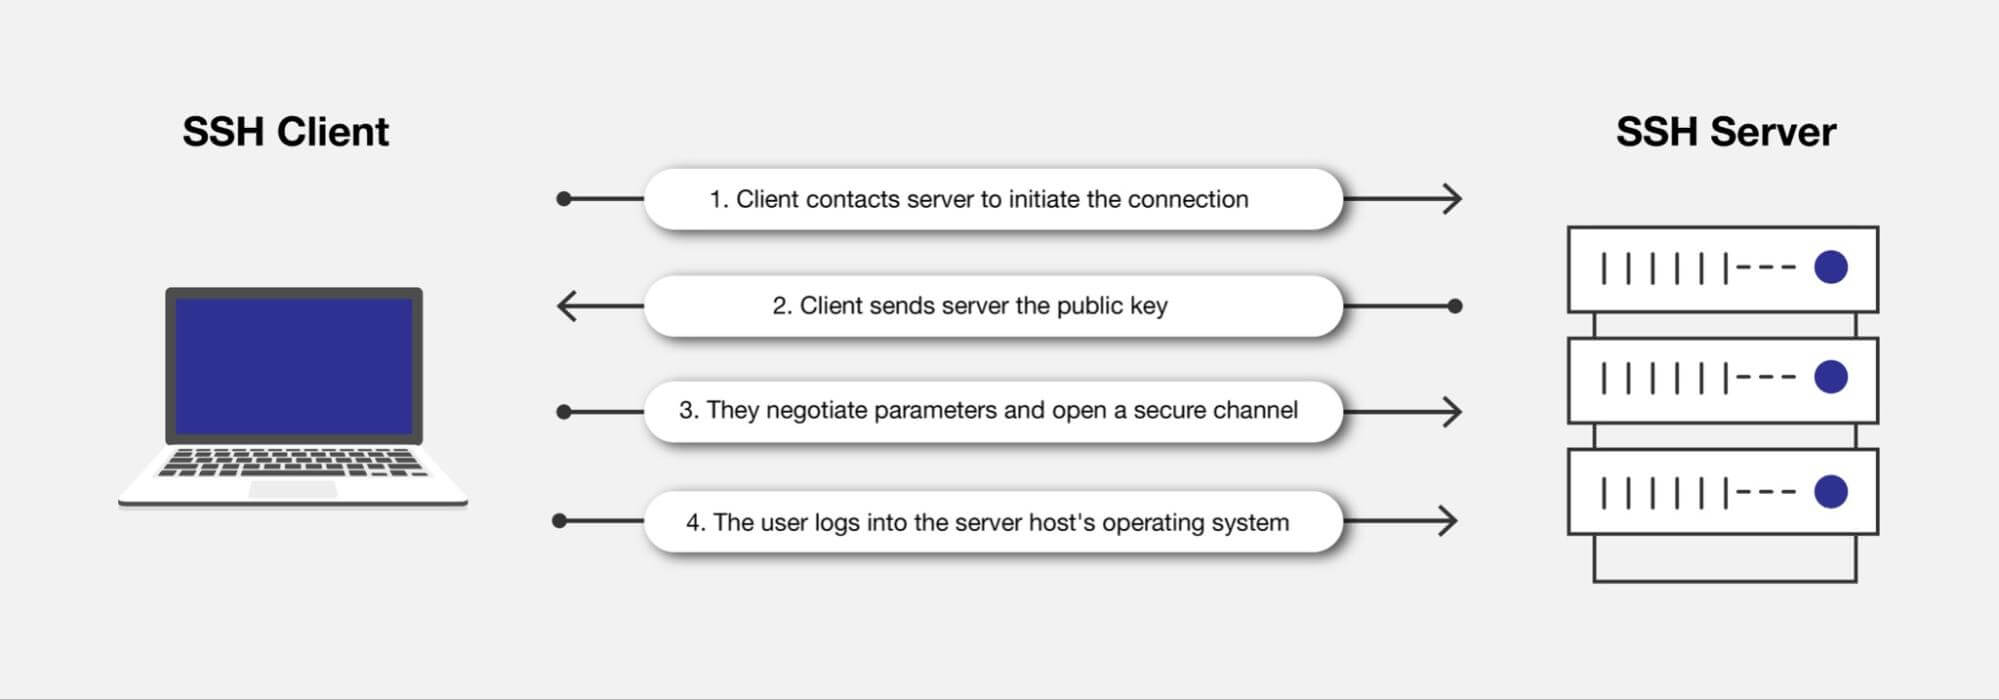
For instance, it only allows connections coming from within a network (typically in the case of a company) or a connection coming from the IP address of your local machine. This limits the number of possible connections to the server.
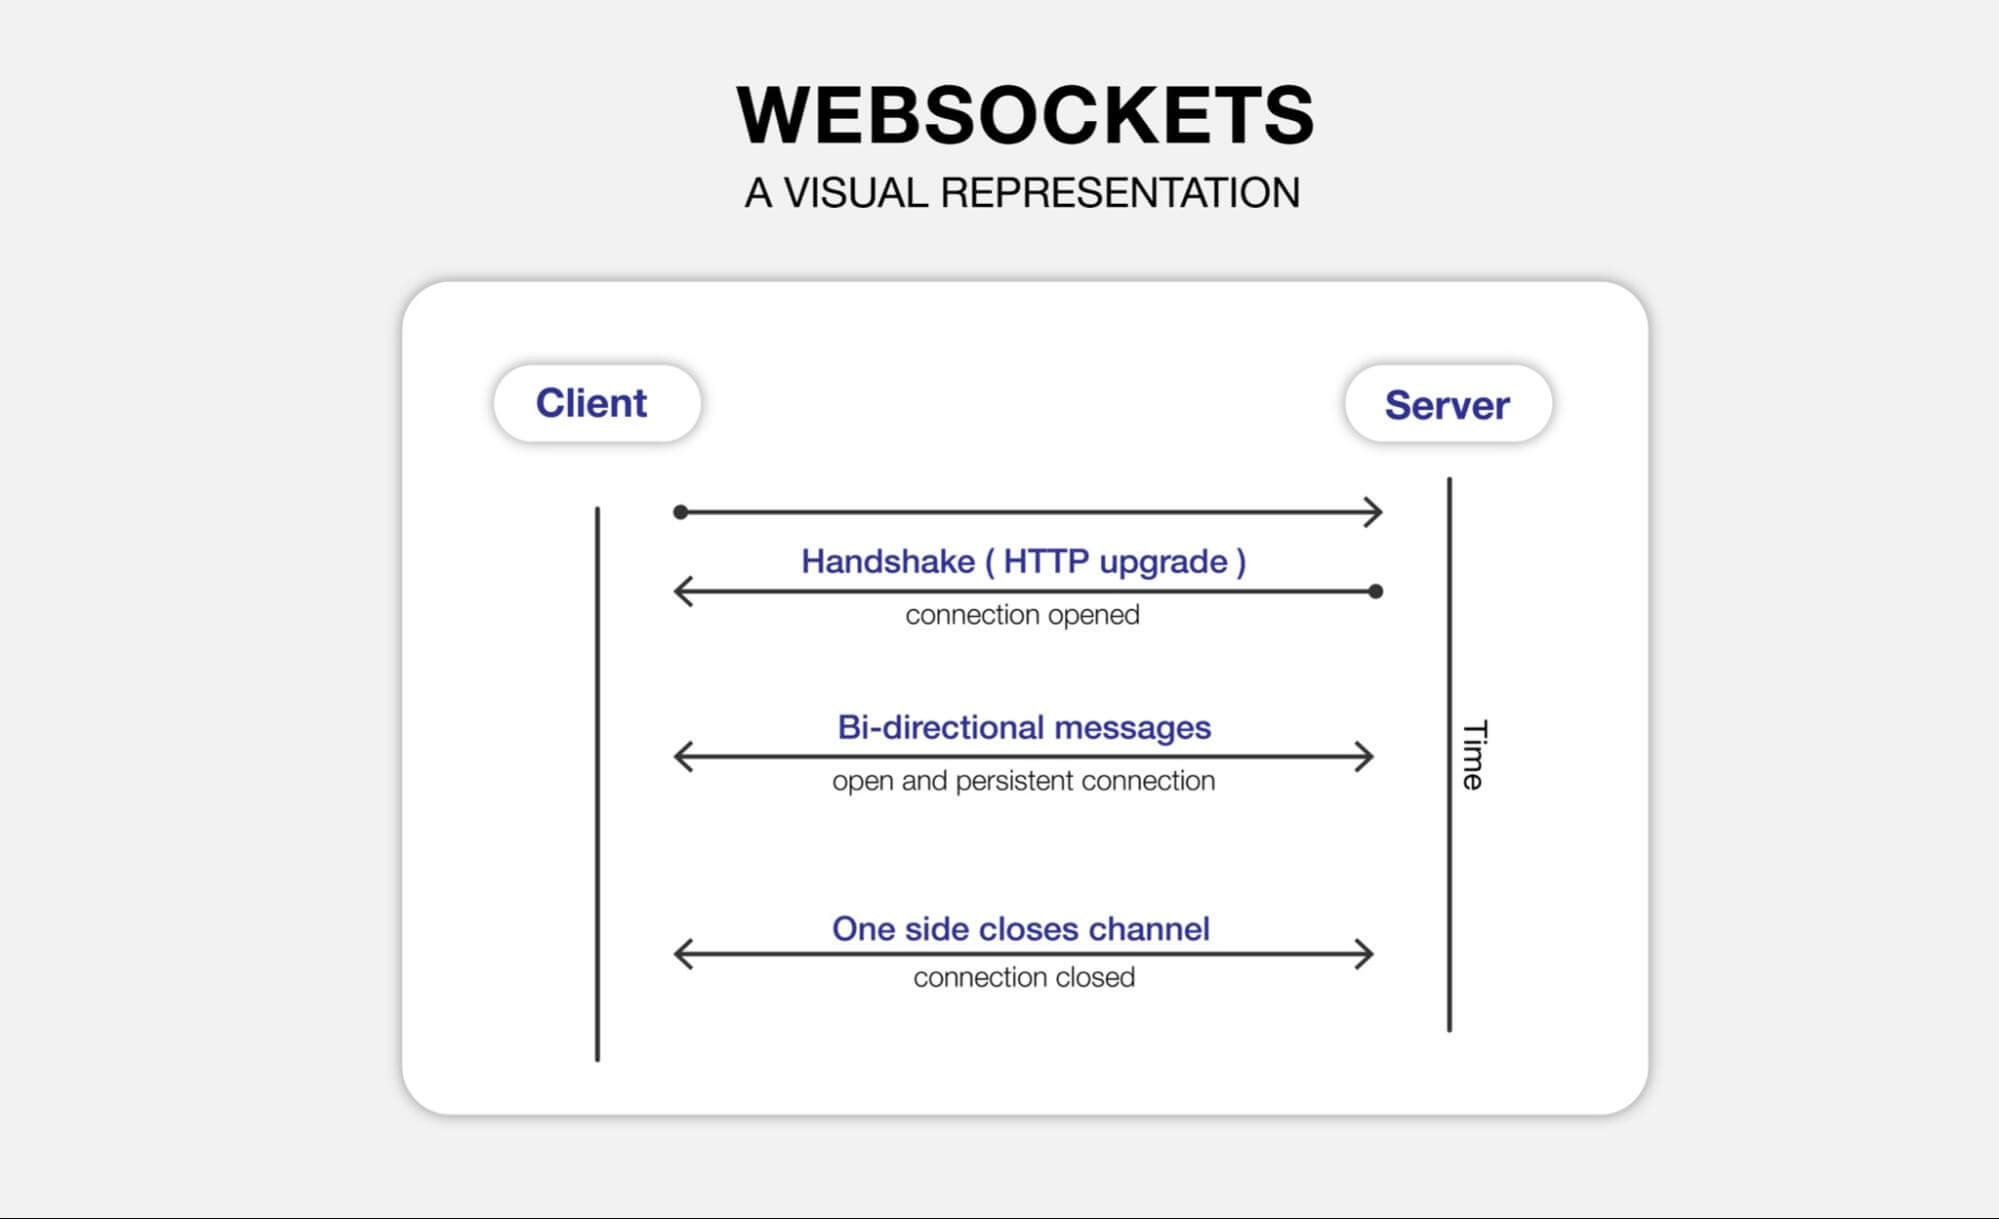
After getting access to the machine over SSH (i.e., having remote access), the next step is to set up the remote debugger. There are various tools and methods to do this. The core ideas that these methods rely on are listeners and web sockets.
Listeners allow a real-time connection to the server such that the debugging process can constantly run without interruption. This is different from an HTTP request, which opens a connection and directly closes it after getting/setting information. Web sockets have a different web protocol than HTTP, and they are the fundamental principle in typical streaming/real-time services.
The final fundamental parts of remote debugging are more related to classic debugging: breakpoints, logs, and stack traces.
Breakpoints allow the code to stop executing at a certain point and check the values of variables at that point. Of course, these can only be used when running the application in debug mode since they will stop the execution once the point is reached.
Logs and stack traces allow developers to check a wide range of values and variables so that they can pinpoint the location of the variables causing the error.
Methods of Remote Debugging
There are many remote debugging tools. The core principles of these tools are:
- Defining “non-breaking” points: You probably have heard of breakpoints. You insert one in a certain line of code. Once the code execution hits that line, the application stops and you can see a stack trace of the values of the variables up to that point for debugging. However, this doesn’t work well when you’re debugging live in production. Non-breaking points can be inserted while your live application is running, without any re-deployment or restarting. They allow developers to see all sorts of stack traces as normal breakpoints.
- Security of source code: Remote debugging connections are designed in such a way that the source code isn’t available on the requests sent over the local machine and the server that you are debugging on.
- Concurrent debugging: This is useful for debugging race conditions where concurrent threads have entered a “deadlock” situation or for debugging a distributed system.
A good example is IntelliJ’s remote debugger. It is quite straightforward to set up. After creating a project, you will have to add a new remote debugger configuration. First, you need to configure the address of the remote machine where the host app will run and then configure the virtual machine options that the host application needs to be started with.
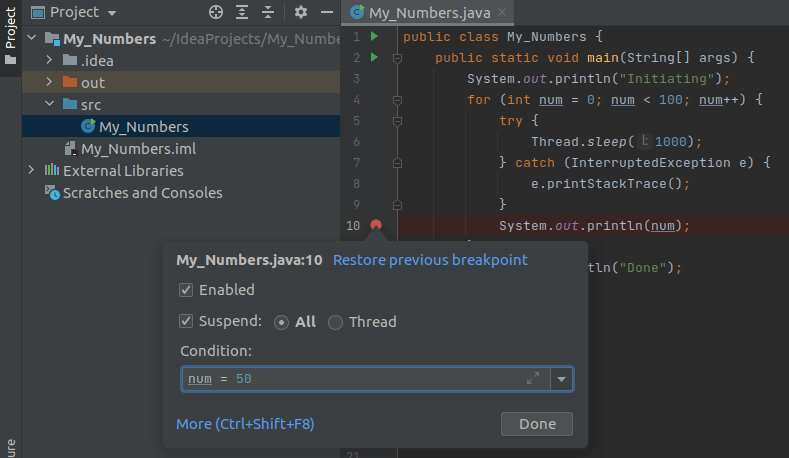
Source: How to Debug Remotely in IntelliJ
After that, you can simply set breakpoints, run the application, look at the debug logs, and terminate the remote debugging session when you are done. This will be quite helpful to get a feel of what remote debugging is like before you go ahead and start using a more specialized production-quality remote debugging tool.
We also have our own tool for debugging live applications: Lightrun. You can start using Lightrun with Java, Python and Node.js applications. Lightrun is a debugging tool that allows you to add logs and metrics in real-time, without stopping your live production application. It helps resolve production issues in microservices, serverless, Kubernetes, and more types of applications. It also gives you performance metrics for your code, helping you monitor and resolve performance bottlenecks.
Why Use Remote Debugging?
According to Queue.acm.org, “Software developers spend 35-50 percent of their time validating and debugging software. The cost of debugging, testing, and verification is estimated to account for 50-75 percent of the total budget of software development projects, amounting to more than $100 billion annually.”
Increasing the efficiency of debugging is very significant. Typical developers debug applications locally, whereas remote debugging offers a much quicker and more efficient solution to debugging.
The next major reason to use remote debugging is to cut down on the unproductive time and resources spent on replicating environments, cloning server code, and configuring things locally. These are often some of the most frustrating tasks that require the input of a lot of team members, especially the senior ones. With remote debugging, this process can be greatly simplified.
Advantages and Disadvantages of Remote Debugging
Advantages of Remote Debugging:
- Fast and Budget-Friendly: Remote debugging cuts down on the time developers spend replicating environments and configurations locally to reproduce the errors and fix them. Errors are a fundamental part of the software. No software is truly 100% error-free, and debugging will always be a continuous process. An efficient organization must optimize this process, and the first step to do so is to use remote debugging instead of local debugging.
- Full of Modern Features: While classic debugging tools offer logging and stack traces, they don’t provide monitoring, AI-powered log filtering, and non-breaking points. These extra features, offered by remote debugging, can help accelerate the debugging process and improve the overall reliability of the system.
Disadvantages of Remote Debugging:
- Heavily Dependent on Permissions: Remote debugging requires access to the server and admin privileges on the server. While this might not be the most difficult process to configure, opening up the server to more remote connections will always increase vulnerabilities, especially if the server contains a database with sensitive information, such as user passwords.
- Sync-sensitive: Source code deployed on the server must be in sync with the code on the remote debugger. While this is possible with web sockets, there is always room for error here, such as scenarios where the editor isn’t entirely in sync and the developer is just debugging on an old version of the source code.
Helpful Tips for Remote Debugging
There are a few different remote debugging tools depending on the programming language being used.
- Java Platform Debugger Architecture: If you are developing for the JVM, have a look at the JPDA. It provides a lot of support for remote debugging. This is also usually used alongside Apache Tomcat and Eclipse.
- Visual Studio Debugging Tools: If you are on a different environment and IDE, VS also provides its own remote debugger. Feel free to check out the documentation here. There are a variety of different remote debuggers provided by Microsoft for different languages and different versions of Visual Studio. Remote debugging in VS Code is also possible.
- Don’t Forget Logging and Exception Handling: Getting into the habit of only remote debugging might not be the best idea. While remote debugging is definitely useful, it works best if it is being performed alongside effective application logging and accurate exception handling. Neglecting those 2 concepts will lead to a mountain of technical debt.
- Selenium Drivers: One more final tip is that current versions of the Selenium driver provide a lot of documentation and methods for remote debugging. For instance, you can find step-by-step instructions online for remote debugging android devices. This is quite helpful since replicating various environments on mobile devices is actually quite difficult.
- Take a look at Lightrun: our live debugger for your production environment. With Lightrun, you can inject logs without changing code or redeploying, and add snapshots: breakpoints that don’t stop your production applications. Lightrun supports Java, Python and Node.js applications, and you can start using it today.
Conclusion
To wrap up, it might be time to start abandoning the old habit of printing variables to the console for hours and hours to find an error. There are a lot of advancements that have been made in the debugging area and remote debugging is definitely one of them. It might not be super simple to get started with remote debugging, but hopefully, you have a much better idea of how to do it after reading this article.


It’s Really not that Complicated.
You can actually understand what’s going on inside your live applications.